


The State of the U.S. Economy, November 2021
I have not updated the leading and coincident economic indicators I have been following for approximately seven months. They have now been updated up to October-November 2021. Having waited that long, we can now get an accurate peek at how the Biden administration’s policies will affect our economic wellbeing. In fact, Biden is destroying the economy.
What the Economic Statistics Tell Us
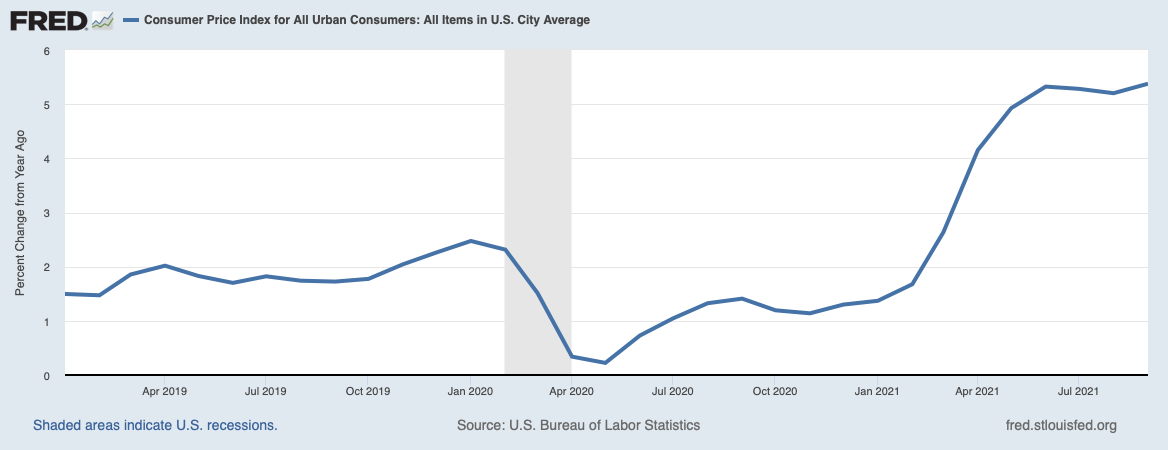
The theme image at the top of this post should fill us with alarm. It is the year-over-year CPI inflation rate up to September 2021. In that month it registered a high +4.5 percent and was growing. [Year-over-year wholesale inflation for September recently came in at +8.6 percent.] While high inflation is itself destructive to our economy, it is also a reflection of other destructive forces at work. The inflation rate (called deflation when the inflation rate is negative) depends on just three variables: GDP growth, the change in the quantity of money in circulation, and the change in the velocity of money. [The velocity of money is defined as the average number of times a dollar changes hands in a year.] We are pushed into an inflationary environment when GDP growth is negative, and the growth in money supply and the change in the velocity of money are both positive. In contradistinction, we are pushed towards a deflationary environment when any of those quantities changes sign. Click here for a PDF explaining all this. So what do economic statistics have to tell us about all this?
Before I attempt to analyze what is going on, I should point out the difference between the two major sets of indicators, i.e. the coincident indicators and the leading indicators. Coincident indicators change in phase with economic growth or decline. Leading indicators change before the economy changes from growth to recession, or vice versa. Each indicator has three possible states: Bearish if the indicator points to recession; Bullish if it indicates growth; or Neutral if it shows neither. I assign a score of -1 to a bearish indicator, zero to a neutral one, and +1 for a bullish indicator. Summing them up for each indicator group then gives the total score for the leading and coincident indicators separately.
In early November 2021, I had eleven leading indicators with five bearish, one neutral, and one bullish for a total score of -9, bearish. Of the seven coincident indicators, seven were bearish, none were neutral or bullish for an overall coincident score of -7 bearish. What these indicators show us is an economy that is currently going to hell in a handbasket. Biden is killing the economy. Let us look at some of the more important indicators, particularly the ones associated with inflation.
Unless stated otherwise, all percent changes of indicators shown below are changes from the previous reporting period, usually monthly. Blue curves are of the indicator itself, and dashed red curves are their percent changes from the previous period.
Let us begin with the amount of M2 money in the system.

St. Louis Federal Reserve District Bank / FRED
Between January 2020 and April 2020, the M2 money supply growth rate soared from -0.09 percent to +6.51 percent. This was almost entirely due to assorted government “stimulation” programs. Then, the growth rate was reduced to fluctuate around 1.0 percent. However, the damage was already done. The money supply continued to rise at an abnormally large level. This growth in M2 supply is not just profoundly bearish, but it might kick off hyperinflation that would substantially destroy the economy.
Another factor that helps determine inflation rates is the rate of growth (or lack of growth) of the GDP. The plot below is of real GDP growth, i.e. with inflation taken out, from Q1 2019 to Q3 2021. Since it is updated every quarter, it is the quarter-to-quarter growth rate.

After the economic gyrations caused by the COVID-19 shutdowns, it has steadily fallen during the last two quarters. In Q3 2021 it fell from the previous quarter to -4.7 percent. Additional evidence is provided by the Atlanta Federal Reserve’s GDPNow estimate for the third quarter of 2021. Its evolution in time is shown below.

This estimate has almost continuously fallen, and as of October 27, 2021, it stood at 0.2 percent. Since it is falling, it is profoundly inflationary.
Then, there is the velocity of money. Since it is slowly falling, it is slightly ameliorating inflation.

St. Louis Federal Reserve District Bank / FRED
M2 velocity is the only indicator among my coincident and leading indicators that has a positive effect on the economy. Then again, since is falling so slowly, it can not overcome the inflationary effects of increased money supply and falling quarter-to-quarter GDP growth.
Yet another problem stifling the economy is the widely noted supply chain failures. Many domestic manufacturers recieve intermediate goods needed to produce final goods for sale from an assortment of international suppliers. They are especially dependent on goods and materials produced by China. In addition, consumers are often dependent on foreign-supplied final goods. For a variety of reasons, this supply chain of intermediate and final goods has been interrupted. This has starved American buyers, both individual and corporate, of needed goods. The causes of this forced starvation will be examined in the next section. However, we should take notice of the severity of broken supply chains as evidenced by the falling inventory-to-sales ratio. As existing inventories of goods are bought up and not replenished, companies’ inventory-to-sales ratios have steadily fallen.

St. Louis Federal Reserve District Bank / FRED
Another economic head-wind is how slowly American labor is returning to jobs after the COVID-19 shutdowns. This is shown by the U3 civilian unemployment rate and the civilian labor force participation rate, shown below.

St. Louis Federal Reserve District Bank / FRED
The U3 unemployment fell continuously throughout President Trump’s administration up to the beginning of the pandemic. Then the coronavirus epidemic hit. The big rise in unemployment between February and April of 2020 was the result of the many state lockdowns during that period. Unemployment in February was 3.5 percent, which then rose to 4.4 percent in March. It peaked at 14.8 percent in April 2020. Since then it has continuously declined through September 2021 when it held a value of 4.8 percent. Yet it has not yet reached its pre-Covid levels and its rate of decline is growing ever slower. Next, consider the changes in the civilian labor force participation rate. Updated monthly, this statistic gives the percent of the adult population that has or is actively seeking a job.

St. Louis Federal Reserve District Bank / FRED
After many years of decline, the labor force participation rate finally seemed to be increasing again during the Trump administration. It peaked at 63.4 percent in January 2020. The slope of the trend line starting in 2017 had a very small positive slope, but the participation rate was still growing consistently. Then the pandemic hit. State economic lockdowns caused a sharp drop to 60.2 percent in April 2020. The index then grew to a plateau of about 61.5 percent, which it reached in July 2020. It has been fluctuating around 61.5 percent up to September 2021. Because it shows no sign of increasing to its levels under Trump and because there is now a general labor shortage, we must rate this indicator as bearish.
Next, let us examine how the Biden administration’s policies are helping to create all these economic problems.
How the Biden Administration Is Killing the U.S. Economy
The last time I went through this exercise in April 2021, the economy was in a much better, albeit fragile condition. How could the Biden administration have trashed our economy so thoroughly in seven straight months? To be sure, our economy is affected in a myriad of ways by the international economy. Yet Biden has done just about everything he could do to make conditions much worse. Let us count the ways.
1. Huge Increases in Government Spending
As the government’s share of GDP increases, our country necessarily becomes more socialist. This observation comes from the redefinition of socialism by Friedrich Hayek in his seminal book, The Road to Serfdom. Recall that socialism’s traditional definition is that it is a system where the means of production are owned by the state. In his book, Dr. Hayek noted that fascism and communism were substantially the same. He wrote his book to debunk a common idea in the 1940s, found particularly in the London School of Economics. That idea was that fascism was the ultimate development of capitalism. This confusion arose from a cosmetic difference between fascism and communism: In fascist states, the means of production were nominally owned by private individuals and companies.
Hayek resolved this quandary by defining socialism as a system in which the means of production are controlled by the state, irrespective of nominal ownership. With this redefinition, socialism and capitalism become polar opposite platonic ideas. They are both conditions that real economies can approach, but never achieve. When we say a particular country is socialist or capitalist, what we mean is that country is closer to one of those platonic ideals than the other.
As the federal government increases allocations of available capital for its own purposes, private companies and individuals are left with smaller fractions of the GDP to invest. That this is happening can be seen in a plot of federal government debt as a fraction of GDP.

St. Louis Federal Reserve District Bank / FRED
The latest publically available value for this indicator is 125.5 percent of GDP in Q2 2021. We know from the researches of Carmen Reinhart and Kenneth Rogoff, as well as a second study by Manmohan Kumar and Jaejoon Woo of the International Monetary Fund, that once government debt exceeds 90 percent of GDP, GDP growth becomes increasingly smaller with increasing federal debt. This is because increasing government control of the economy magnifies government misallocation of capital. It also crowds out private companies from financial markets. For empirical evidence showing this is true, see my post Comparing Economies of All Countries on Earth in 2019. I do the same job in a slightly different way in the post How Much Human Freedom Can We Find in the World. For the reasons why the empirical data behave in the way they do, see the post How Is the Weather Like a Country’s Economy? Biden’s administration has two infrastructure bills, the first and least expensive of which is a more-or-less traditional infrastructure bill. That one has been passed and signed into law. It will cost roughly $1.2 trillion, or about 4.3 percent of current GDP, over a decade. The second and more expensive “social infrastructure” bill has not yet been passed and might cost as much as $3 trillion, or 12.9 percent of GDP, over ten years.
2. Biden’s Climate Plan and the Reduction in Energy Supplies
Biden’s climate plan is a subset of the progressives’ even more extreme “Green New Deal.” A portion of it was included in the $1 trillion infrastructure act that has already been passed and signed into law by President Biden. In that act, about $50 billion was allocated to help communities recover from storm damage. Other allocations include:
- $7.5 billion to create a national network of charging stations for electric vehicles.
- $21 billion to cleanup contaminated sites, and to cap oil and gas wells.
- $55 billion to insure communities’ access to clean drinking water.
- $65 billion for developing non-fossil fuel energy (so-called “clean energy”), and to adapt electric grids.
The portion of the infrastructure act that is allocated to global warming issues adds up to a grand total of $198.5 billion.
However, the core of Biden’s climate plan resides in the yet to be passed and more expensive Build Back Better Bill. It has passed the House of Representatives. It now goes on to the Senate, where it faces an uncertain fate. The climate plan in this bill consists of a $555 billion package of tax credits, grants, and supporting policies. They are aimed at drastically reducing carbon dioxide emissions, which progressives believe cause global warming.
In addition, Biden has used existing regulatory powers to shut down oil and gas pipelines and production. Under President Trump’s energy policies, the U.S. had become self-sufficient in energy supplies. With his policies encouraging domestic fossil fuel production, the U.S. depended on no other country for its energy supplies. The U.S. was even exporting fossil fuels. Now that Biden has reversed all of Trump’s policies, the United States’ energy supplies have been greatly reduced. This has led to considerable inflation for vehicular fuels, causing rising prices for any product requiring vehicular transportation. It also has created inflation for any product requiring energy for its fabrication — namely for everything produced. In this way, Biden’s climate policies are complicit in the observed widespread supply-chain disruptions, both international and domestic. To be sure, there are many other international causes for these disruptions, but Biden’s energy policies contribute greatly.
There are at least two major ways to criticize Biden’s climate plan. One is to show that even if humankind is causing global warming through carbon dioxide emissions, it is not an existential threat. This is the view championed by Bjørn Lomborg. He believes adapting to global warming, rather than stopping it, is much more conducive to the welfare of human beings. He argues global warming is not an existential threat, even though it does pose a problem to which we need to adapt.
A second way of attacking Biden’s climate plan is to show that a number of facts about atmospheric CO2 show it can not possibly be the cause of observed global warming. There are a series of five of these facts, which interact to make significant global warming impossible.
You will find the arguments justifying the attacks on Biden’s climate plan in the post The Idiocy of Joe Biden’s Climate Plan.
From all of these facts about atmospheric carbon dioxide, we must conclude that everything Joe Biden wants to do about global warming is wasted effort and wasted misallocation of scarce capital. In fact, what Biden is doing is downright harmful to the economy. The harm is caused by denying needed fossil fuels and by denying corporations the use of much capital for investments.
3. Encouraging Individuals to Stay Out of the Labor Force
Large increases in government spending and Biden’s version of the Green New Deal are not the only ways in which Biden is destroying our economy. Additionally, Biden’s policies are discouraging participation in the labor force. According to the U.S. Bureau of Labor Statistics, the latest figure available for non-farm job openings in September 2021 was 10.4 million jobs. This increase in job openings occurred with the elimination of many state economic shutdowns during the covid-19 epidemic.

Data and Image Source: U.S. Bureau of Labor Statistics / U.S. Department of Labor
Yet, only 6.18 million people were actively looking for work in October 2021, according to the Federal Reserve Economic Database at the St. Louis Federal Reserve District Bank. This has been the cause of much of the observed supply-chain disruptions. You cannot supply goods if you cannot produce them because of a lack of labor. Note how this is all confirmed by the plot of the labor force participation rate shown earlier.
Why the mismatch between the number of available jobs and the number of people looking for them? Wages are not the problem. On a yearly basis wages were up by 4.6% in September. After you take out inflation, this shrinks to an increase of 0.2%. Yet, while real wages have not appreciably increased under Biden, they have not shrunk either.
Over the past year, Biden’s administration provided covid-19 welfare entitlements that created a big disincentive to work. Federal unemployment benefits that began under Trump were extended by Biden in March and finally ended in September. However, other federal disincentives to work continue. For example, the IRS pays families a child tax credit of $3,600 per child under six, and $3,000 per child for older children. In addition, the Treasury Department has told states that some of the $350 billion stimulus money sent to them can be used to expand state unemployment benefits. Even before the pandemic, over the last two decades, the federal government had been discouraging work by means of less restrictive unemployment benefits, increasingly more generous social-welfare payments, and growing disability payments. The various covid-19 rescue plans have greatly added to all these work disincentives. The American Rescue Plan Act of 2021 added $1.9 trillion (a little less than 10% of GDP) to these disincentives.
4. Biden’s Proposed New Taxes
Finally, to finance the huge increase in government spending Biden proposes in his Build Back Better Bill, he proposes an increase in taxes of nearly $2 trillion dollars, approximately 10% of GDP. These include taxes on unrealized capital gains over $1 million at the death of a single taxpayer, $2 million for joint filers. This is in fact a wealth tax. Biden claims these increases will hit only “the rich” and corporations.
Yet, the unanticipated secondary effects of these humongous tax increases will hurt everyone, the poor included. It will remove capital from private companies (and the rich) to invest on increased production of wealth. As a result, jobs and wages will decrease from what they would otherwise would be. If capital available decreases below replacement investments (i.e investments to replace worn out or obsolete equipment, or to train labor to use more modern replacement equipment), then job and wage decreases will be real, not just potential. Combined with the incipient hyperinflation, the resulting economic stagnation will remind us of Jimmy Carter’s stagflation. We should start keeping track of the misery index.
May God save us all.
Views: 2,263