


Comparing Economies of All Countries on Earth in 2019
In June, 2016 and September, 2018, I wrote posts that compared the economies of all countries on Earth for which data was available. My purpose was to examine which of the two major ideological sides had a better grasp of social reality. This post attempts to update those comparisons using data from 2019.
Only two major ideological sides? There are, in fact, a huge number of ideologies available, probably one for each human being on Earth. An ideology is a coherent system of ideas used to explain observed reality. As is usual, I am restricting the use of the word to idea systems used to explain social phenomena.
Yet, all such ideologies concerning social systems seem to fall under one of two major sets of ideologies. One, which I call dirigisme, believes governments should be the main tools to solve all major social and economic problems. The other, which I call neoliberalism, believes governments are rarely competent to solve social and economic problems. In fact, neoliberals believe governments are usually the cause of our greatest social and economic problems.
Can we discern from empirical data which set of ideologies is more accurate?
Where the Data Comes From
Almost all the data used in this essay comes from the World Bank. In turn, the World Bank gathered most of it from the Organization for Economic Cooperation and Development (OECD). Some data came from the U.S. Federal Reserve’s Federal Reserve Economic Database (FRED). Some came from the Heritage Foundation’s Index of Economic Freedom.
The Heritage Foundation’s Index of Economic Freedom plays a particularly important role in this discussion. It is a measure of how much a government controls its country’s economy. The index is constructed to have a value of zero when a government has total (or close to total) control of its economy. A value of zero means there is absolutely no economic freedom for the individual citizen. At the other end of the scale, a value of 100 denotes absolutely no government influence on the economy. Needless to say, no actual country will reach either end of the scale.
The Index of Economic Freedom is calculated as a simple arithmetic average of 12 quantitative and qualitative factors. Each one measures a different way in which a government interacts with its country’s economy. They are grouped in four separate categories, which are shown in the list below, with their individual components listed below them.
- Rule of Law
- Property Rights
- Government Integrity
- Judicial Effectiveness
- Government Size
- Government Spending
- Tax Burden
- Fiscal Health
- Regulatory Efficiency
- Business Freedom
- Labor Freedom
- Monetary Freedom
- Open Markets
- Trade Freedom
- Investment Freedom
- Financial Freedom
Click here to see a detailed explanation of the Heritage Foundation’s methodology in calculating the index. For the rest of this essay, I will usually refer to a country’s Index of Economic Freedom simply as its economic freedom.
The rest of the data are measures of how well a country’s economy performs its economic and social functions. They include such measures as Per Capita GDP, GDP growth rates, the GINI index that measures how equitably GDP is distributed, the U.N.’s Human Development Index, and government spending as a fraction of GDP.
What the Countries of the World Have to Tell Us
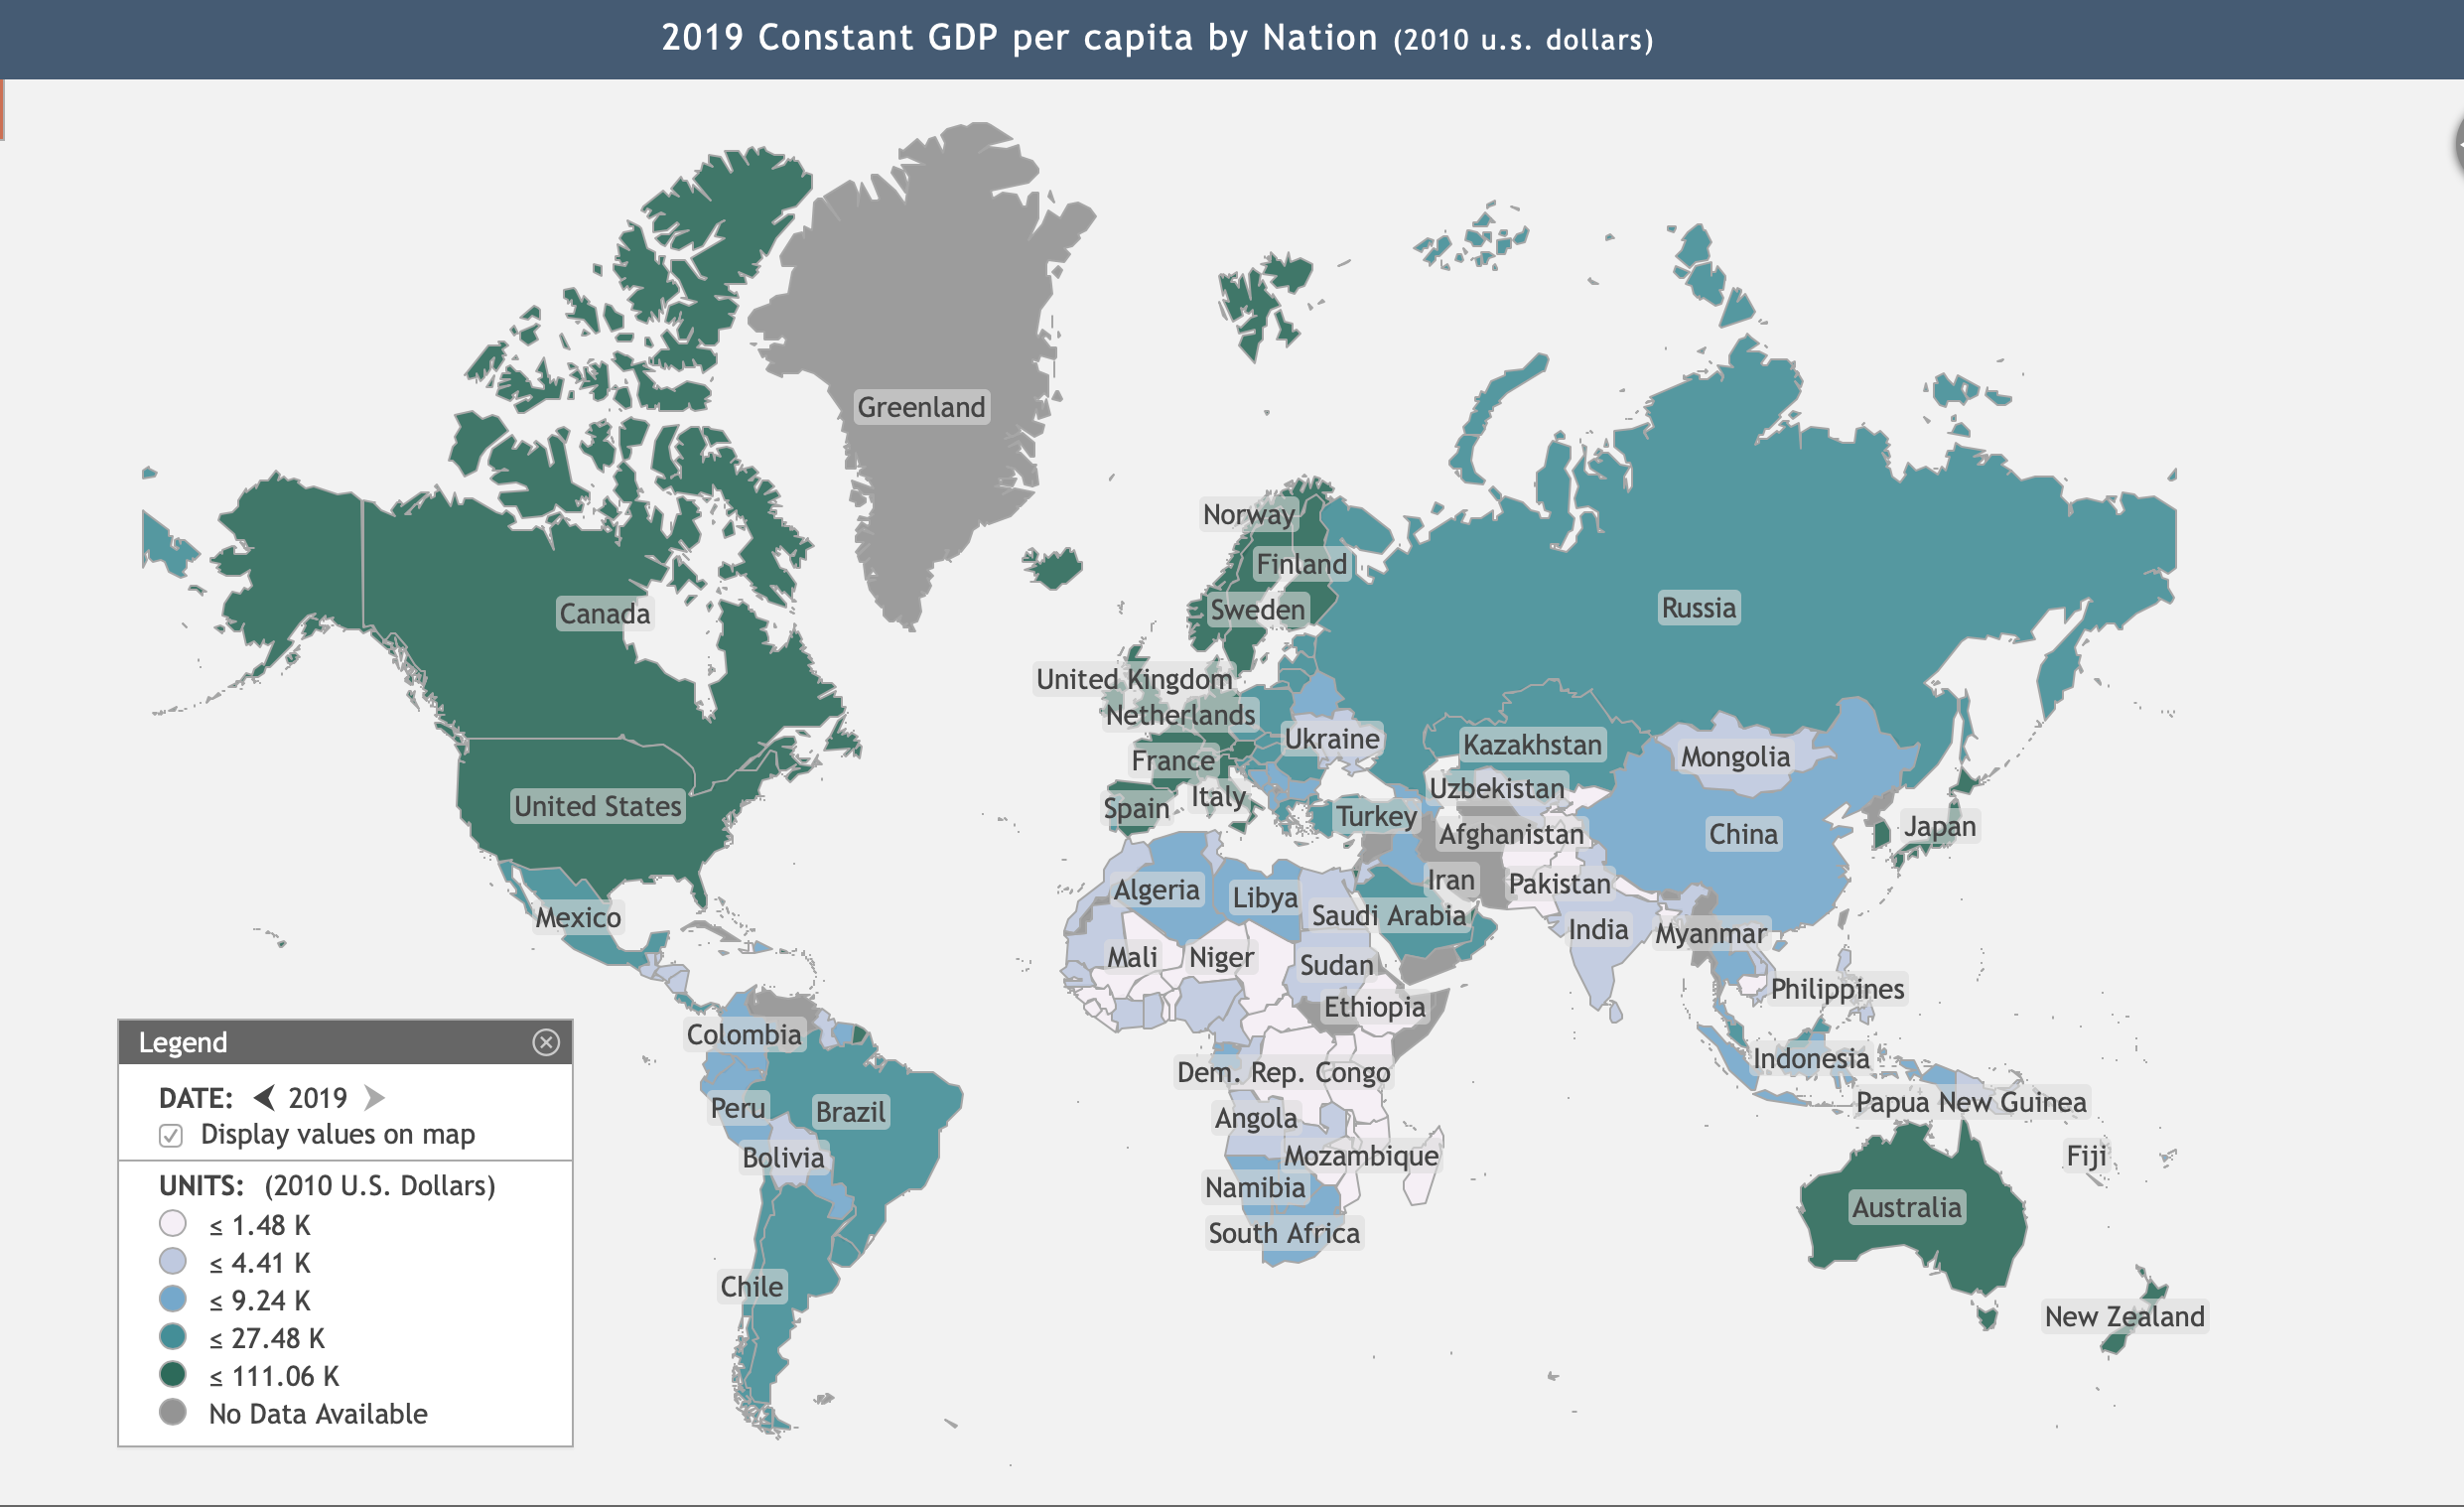
We will begin by comparing every nation’s Per Capita GDP as a function of their economic freedom. This will be done with a scatter plot of their per capita GDP in constant 2010 US dollars versus their economic freedom. To facilitate this, we will divide the countries into three major groups: developing countries with per capita GDP in constant 2010 U.S. dollars of less than $15,000, intermediate countries with per capita GDP between $15,000 and $35,000, and developed nations with per capita GDP greater than $35,000.

The developing countries are represented by red crosses, intermediate countries with brown x’s, and the developed countries by blue boxes. Clearly, the lesson of this plot is that the higher a nation’s per capita GDP and the greater its economic development, that nation’s per capita GDP tends to grow exponentially with economic freedom. In fact, if we were to fit an exponential curve to this data, this plot shows the growth in per capita GDP becomes clearly exponential with economic freedom greater than 60.
Of course, nothing guarantees a high GDP per capita is widely distributed among the country’s citizens. The measure for how evenly it is distributed is the GINI Index. It is usually scaled to vary from zero to 100. When it is zero, the GDP is evenly distributed among all citizens. When it is 100, only one person possesses the entire GDP and everyone else has nothing. While we might debate what the optimum value of the index might be, most people would want the Gini index to be low. Plotting the GINI index versus economic freedom produces the graph below.

Data Sources: The World Bank and the Heritage Foundation
Obviously, the linear fit to the data has a negative slope. As countries become more economically developed with higher economic freedom, the GINI index becomes smaller. Therefore, a country’s GDP tends to become more evenly distributed with higher economic freedom.
Next, we should see how the United Nations’ Human Development Index (HDI) varies with economic freedom. It is constructed as a geometric mean of three components, each of which is constructed to vary from zero to one. One component is a measure of how long people are expected to live in that country, a second is a measure of the population’s educational attainments, and the third is a measure of the Gross National Income (GNI) per capita. You might consider the HDI as a measure of a citizen’s opportunity to have a satisfying life. The scatter plot for countries’ HDI versus their economic freedom in 2019 is shown below.

Data Sources: United Nations and the Heritage Foundation
This plot strongly implies that people’s lives have greater quality as economic freedom and economic development increase.
Yet another economic figure of merit is the GDP growth rate, shown below as a function of economic freedom.

Data Sources: The World Bank and The Heritage Foundation
Although there is a great deal of spread in the data, especially at lower levels of economic freedom, as economic freedom increases, GDP growth generally decreases. However, as economic freedom increases, so does economic development and therefore GDP per capita. The explanation for why any trend line would have a negative slope can be found in the Solow-Swan growth model. I discussed this model in the three posts The Solow-Swan Model and Where We Are Economically (1), The Solow-Swan Model and Where We Are Economically (2), and The Solow-Swan Model and Where We Are Economically (3).
It is well known that economic growth is generally much faster for undeveloped countries than for developed ones. The Solow-Swan model gives the explanation. The heart of the Solow-Swan model is a description of how GDP (represented by the letter y) is a function of three variables: the amount of total capital invested (k), the total number of laborers employed, and something called the total factor productivity (A). This relationship, called the Cobb-Douglas production function, can be cast in the form
^\alpha = Af\left (\frac {k}{l} \right)")
where f(k/l) must be an increasing function of its argument, and where α can be set between zero and one. All the variables in this equation must be considered to be functions of time. Although this expression gives the GDP per laborer, it can be considered as a stand-in for per capita GDP.
One characteristic of developing nations is they have large quantities of unutilized labor and available capital (often from foreign investors). All they need for further development is to put that labor and capital to work. However, as they transition to developed status, most labor and capital has already been used. GDP growth slows.
This means the path of developed nations to further development is restricted to increasing their total factor productivity, A. This is done by finding more efficient ways of producing goods and services already available, or by finding new goods and services that would be in demand. Either path usually requires a large amount of expensive research. For these reasons we expect GDP growth to be slower for developed countries than for those still developing.
However, suppose we repeat the plot above three times: once each for developing nations, intermediate nations, and developed nations. Then the effect of development status would be substantially separated out. Doing that, we get the following three plots.

Data Sources: The World Bank and The Heritage Foundation

Data Sources: The World Bank and The Heritage Foundation

Data Sources: The World Bank and The Heritage Foundation
The scatter plot for developing countries shows no discernible trend with increasing economic freedom. I did not even try to find a trend line for that case. However, both intermediate and developed countries show general increases in GDP growth rates with increasing economic freedom. Note that the slope of the trend line for developed countries is smaller than that for intermediate countries.
These observations underline the importance for intermediate and developed countries of freeing up existing capital for use by companies for research to increase total factor productivity. If those countries’ governments hog that capital for government programs, we can expect economic growth to suffer. This assertion is demonstrated by Rahn’s curve. This is a plot of a country’s GDP growth as a function of government expenditures as a fraction of GDP. Below is a scatter plot for all nations in 2019, for which data is available, of their GDP growth rates versus their governments’ expenditures as a percent of GDP.

Data Source: The World Bank
Clearly, no matter what their development status, countries’ GDP growth rates tend to decrease with increasing government expenditures. Suppose we try to discern how governments’ expenditures change with increasing economic freedom? The plot below shows the results.

Data Sources: The World Bank and The Heritage Foundation
From this plot, we see government expenditures as a share of GDP tend to decrease with increasing economic freedom, especially for intermediate and developed economies.
What Can We Conclude?
So, what does all this data tell us? No matter what figure of merit for the economy we have examined — per capita GDP, GINI index, the U.N.’s Human Development Index, GDP growth rates, or government expenditures as a share of GDP — countries fare best with larger values of economic freedom. GDP growth rates gave the most ambiguous answers about what was best. However, once we took into account countries’ development status, growth rates clearly were better with greater economic freedom for individual citizens and companies.
All that I have written so far only gives an empirical justification for limiting a government’s role in society. Yet, one can easily construct an ideological picture, i.e. a theoretical explanation, for why all this is true. I have written about this theoretical explanation in the following posts.
- How Is the Weather Like a Country’s Economy?
- Chaotic Economies and Adam Smith’s Invisible Hand
- The Rahn Curve: What Makes Economies Grow?
A consistent theory justified by empirical data gives American neoliberals (aka conservatives) a winning intellectual position.
Views: 3,891
It’s a pleasure to congratulate on the work done. I remember having had a look at your previous exercises and having found found them of great interest.
Keep the good work!
Many thanks for your kind words!