


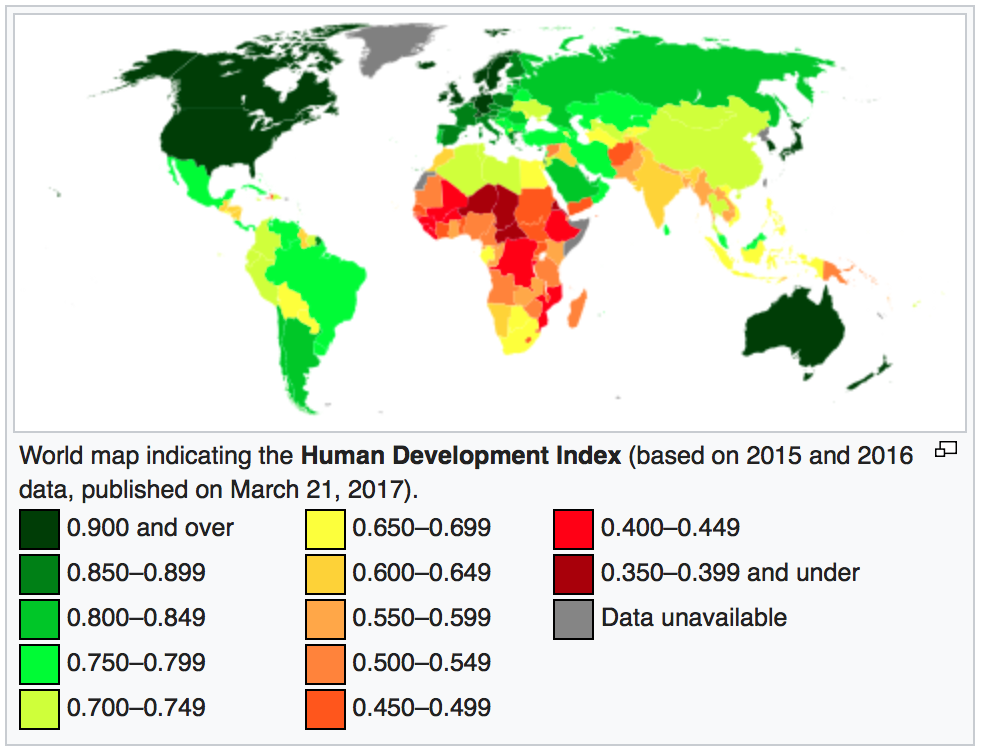
The Human Development Index and Economic Freedom
Wikimedia Commons / User Happenstance
Recently, I learned about a figure of merit for countries being promoted by the United Nations that blends economic data with statistics related to the quality of life. Called the Human Development Index (HDI), it was originally developed by the Pakistani economist Mahbub ul Haq for the UN. The HDI for every country for which there is data is published annually by the United Nations Development Programme’s Human Development Reports. Comparing countries’ HDI as a function of their economic freedom from government turns out to be a very rewarding exercise.
How the HDI Is Calculated
The UN’s Human Development Index is composed as a geometric mean of three components, each of which is constructed to vary from zero to one. One component is a measure of how long people are expected to live in that country, a second is a measure of the population’s educational attainments, and the third is a measure of the Gross National Income (GNI) per capita. The GNI is GDP (the sum total of what is produced domestically by citizens) plus income paid into the country from overseas for such things as interest and dividends, minus similar payments paid out to other countries.
The sub-components of the HDI are computed as follows:
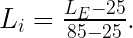
- Life expectancy component, Li: If a person’s life expectancy at birth is LE, the life expectancy index is given by
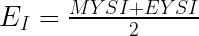
Note that if the sub-index LE is 25, the index is zero, and Li is one if the sub-index is 85. Any calculation with a negative result is reset to zero, and any calculation giving a result larger than one is reset to one. - Education component, EI: This component is computed from two sub-indices: The Mean Years of Schooling Index (MYSI) and the Expected Years of Schooling Index (EYSI) according to the formula
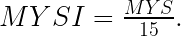
The two sub-indices, which are forced to remain between zero and one, are calculated as follows:- Mean Years of Schooling Index
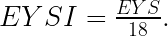
where MYS is the actual mean of the years of schooling in that country. Fifteen is the UN’s projected maximum for the MYS for 2025. - Expected Years of Schooling Index
where EYS is the expected years of schooling for that country. Eighteen is the equivalent of achieving a master’s degree in most countries.
- Mean Years of Schooling Index
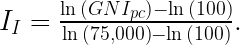
- Income Index, II:
In this formula, GNIpc is the Gross National Income at purchasing power parity per capita. Again the index is forced to remain within the boundaries of zero and one.
Once, all the sub-indices have been calculated, the actual HDI is calculated as the cube-root of their product.
![HDI = \sqrt[3]{L_I \cdot E_I \cdot I_I }](https://s0.wp.com/latex.php?latex=HDI+%3D+%5Csqrt%5B3%5D%7BL_I+%5Ccdot+E_I+%5Ccdot+I_I+%7D%C2%A0%C2%A0+&bg=ffffff&fg=000&s=3&c=20201002)
The geometric mean has the nice property that since all the sub-indices vary from zero to one, so will the HDI. In addition, if any of the sub-indices goes to zero, so will the HDI.
The Relation of a Country’s HDI to Its Economic Freedom
We can surmise that any country with an HDI of zero would be hell on Earth; and any country with an HDI of one, if not heaven on Earth, would at least be a very, very nice place to live. The question to be asked now is: How do countries’ HDIs vary with different amounts of government intrusion (progressives would say with different degrees of government management) of their economies? Progressives would claim that as government management of an economy declined, so would its HDI; and of course, neoliberals would claim exactly the opposite. I have played this game before using the Heritage Foundation/Wall Street Journal Index of Economic Freedom as a measure of a government’s intrusion into the mechanics of its economy. If the government had absolutely no effect on the economy and the economy was completely free from government, the economic freedom index would be 100. As government economic control grows, the index decreases. If the government has total control of the economy and makes all economic decisions, the index of economic freedom is zero.
In the past I have constructed scatter plots of various figures of merit for countries versus their index of economic freedom. For example, taking the y-axis as the GDP per capita and the x-axis as the index of economic freedom, I would plot one dot on the plot for every country for which there was data. I made a similar plot for the GINI index versus economic freedom. We can answer our query about how countries’ HDIs vary with a similar scatter plot for HDI versus economic freedom. What results is shown in the scatterplot below.

Data Source: UN Development Programme / Heritage Foundation
Clearly, as the index of economic freedom increases, so in general do countries’ HDIs. Since one would expect as many cultural determinants for a country’s HDI as economic, it is not at all surprising there is a great deal of scatter in the country points, especially at the lower values of the economic freedom index. What is a surprise is that as economic freedom increases and the HDIs approach their ideal value of one, the scatter progressively narrows. What this says is that whatever cultural variables influence HDI, they are so tightly coupled to economic freedom at high values of both indices that the index of economic freedom becomes a progressively better predictor of HDI,
This observation becomes even more striking when you compare this plot with the scatterplot of countries’ GDP per capita versus economic freedom.

With this plot we can see the scatter is least at lower values of economic freedom, but increases rapidly when the index exceeds 60. I have attributed this to the multi-dimensional character of economic freedom. Currently, there are 12 components of the index of economic freedom, each component measuring a separate way government can control or influence the economy. From the higher scatter of country points at the larger values of the index, we must conclude some ways of reducing government control are considerably more effective at increasing GDP than others. So why does HDI versus economic freedom not exhibit the same behavior?
The answer comes from examining the components and sub-components of the HDI index. Besides GNI per capita, HDI goes up with increases in life expectancy and the country’s general education level, both of which are very expensive to achieve. In addition, just to be able to function at a high level of economic freedom requires a large number of managers of private businesses with the requisite knowledge and length of experience to effectively control their organizations. And the larger the number of high technology companies they manage, the more they will need highly educated and experienced workers to conduct their business. This means every country with a high index of economic freedom, no matter what path they take in the 12-dimensional economic freedom space, must have high values of the life expectancy and education indices for their economies to be stable. In fact, to increase economic freedom means to increase reliance on the private sector, which depends on even more experienced (i.e. long-lived) and educated workers and managers. Without those two indices being high, the society can not maintain a high level of economic freedom. Since every country with high economic freedom generally must have large values of Li, Ei, and GNIpc; and since to increase economic freedom means those factors must increase; and since the high-freedom countries are already beginning to push the ideal boundary of HDI equaling one, the countries at high economic freedom are getting squeezed into an increasingly small area of the economic freedom-HDI plane.
It would appear that a high level of human well-being requires free-markets!
Views: 12,261