


The U.S. Economy, April 2021
I have just updated the leading and coincident economic indicators I am following, the first update I have done in a year. The last year has been extremely crazy economically. Every time I thought about updating my economic indicators in the last year, I decided to wait for the rapidly changing economic environment to become clearer. Now that I have finally updated my indicators, it is time to take a more analytic view of just what is happening to our economy, and why.
What the Economic Statistics Tell Us
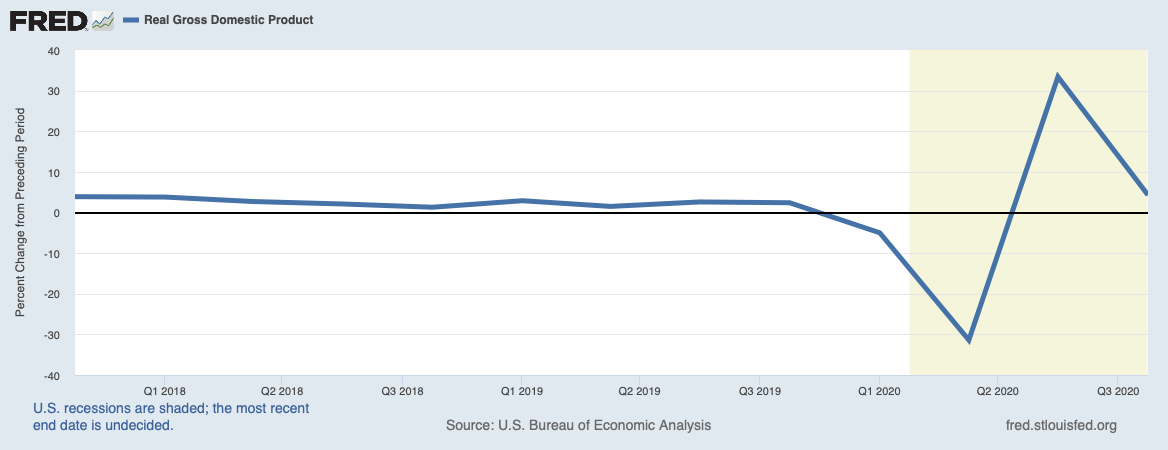
The image at the top of this post tells a tale repeated over and over again by the economic statistics. Our national economic conditions were generally good to very good throughout the Trump administration. And then the COVID-19 pandemic hit. What followed was a sharp economic crash caused by total economic shutdowns by the various state governments. This was succeeded by equally sharp recoveries as some states relaxed their economic shutdowns. Then, the economy’s condition would fall again to more realistic levels. This fall to realistic levels was only partially because the system could not practically sustain greater growth. Also, as succeeding phases of the epidemic hit, many states would reinstitute their shutdowns.
Before I attempt to analyze what is going on, I should point out the difference between the two major sets of indicators, i.e. the coincident indicators and the leading indicators. Coincident indicators change in phase with economic growth or decline. Leading indicators change before the economy changes from growth to recession, or vice versa. Each indicator has three possible states: Bearish if the indicator points to recession; Bullish if it indicates growth; or Neutral if it shows neither. I assign a score of -1 to a bearish indicator, zero to a neutral one, and +1 for a bullish indicator. Summing them up for each indicator group then gives the total score for the leading and coincident indicators separately.
In April 2021, I had eleven leading indicators with five bearish, one neutral, and five bullish for a total score of 0, neutral. Of the seven coincident indicators, one was bearish, one was neutral, and five were bullish for an overall coincident score of +4 bullish. What these indicators show us is an economy that is currently in much better shape than we could have expected from the various state shutdowns. However, the leading indicators tell us the U.S. economy is extremely fragile. Any shock could throw it into recession, or even depression.
Now, let us take a look at some of the more important indicators to see what they can tell us about what is happening. During the depths of the COVID-19 epidemic, I wrote about how we could expect great inflation from the CARES (Coronavirus Aid, Relief, and Economic Security) Act. The CARES Act was designed to rescue the financial lives of businesses and individuals from the scourge of the COVID-19 epidemic. It mandated a tremendous increase in the money supply at the same time GDP growth became greatly negative. Both of those factors are inflationary. The third factor is the percent change in the velocity of money. The velocity of money is the average number of times a dollar changes hands in a year. An increase in the velocity of money is inflationary. As it turns out, we have been saved from inflation so far by a decrease in the velocity of money. While the economy was shut down, people bought fewer goods and services. The time evolution of each of the three factors determining the rate of inflation is shown in the plots below.

St. Louis Federal Reserve District Bank / FRED

St. Louis Federal Reserve District Bank / FRED

St. Louis Federal Reserve District Bank / FRED
While the growth of the money supply remains large, the latest GDP growth in Q4 2020 is at a reasonable +4.3 percent. The velocity of money also remains at low levels. GDP growth and money velocity currently put us in a noninflationary environment. However, should anything happen to decrease GDP growth at the same time people start spending their money with the opening of the economy, large inflation rates will again become a threat. A great increase in government spending could also increase both the money supply and money velocity to put us in large inflation.
An indication of future economic growth is given us by manufacturers’ new orders for nondefense capital goods and for durable goods. Their time evolutions are shown in the two plots below.

St Louis Federal Reserve Bank / FRED

St. Louis Federal Reserve District Bank / FRED
An indicator that we usually would consider pointing toward growth is the inventories to sales ratio. It is currently low, as shown below.

St. Louis Federal Reserve District Bank / FRED
This index would be considered a bullish indicator in normal times. However, with demand being stoked by government programs and production stifled by the many state lockdowns, a reduction in inventories is likely to lead to high inflation. I consider this to be bearish.
One negative coincident indicator is retail sales excluding food services, plotted versus time below.

St. Louis Federal Reserve District Bank / FRED
This index increased sharply in the fourth quarter of 2016 and immediately after Donald Trump was elected president. Retail sales continued to increase until July 2018 when it started to decline slightly on trade war fears. Nevertheless, after March 2019 retail sales began to grow again until the coronavirus pandemic hit. Retail sales’ annual rate of growth fell from a +4.70 percent in February 2020 to a -15.33 percent decline in April 2020. The month-to-month rate of growth fell from +0.41 percent in January 2020 to -12.66 percent in April 2020. In the very next month of May 2020, it jumped to +17.26 percent. Since the rebound, retail sales have declined on average. Its latest growth value in February 2021 was -3.07 percent. Because it is generally falling, I rate this index as bearish.
So how is the economy affecting personal incomes? This is shown in the month-to-month percent change of real personal income excluding current transfer receipts, shown below. Since this is real personal income, it is income after inflation is taken out.

St. Louis Federal Reserve District Bank / FRED
After the start of the pandemic, the month-to-month rate of change reached a minimum of -5.81 percent in April 2020, only to rebound to +1.72 percent in May. Its latest value was 0.20 percent in February 2021. This last value translates to approximately +2.4 percent annually. Because personal income is still increasing after inflation is taken out, we must consider this indicator has to be bullish.
Progressive critics might claim the rise in personal income is all well and good, but that the vast majority of it goes to the very rich. This is a false claim. As I noted in the post Progressives Are Wrong: Income Inequality in the U.S. Is Not Increasing!, this progressive assertion depends very much on what you mean by the word “income.” What progressives define as income is the sum of an individual’s wages, capital gains, and rents. Call this “earned income.” However, what matters to an individual is the amount of money he/she has at their disposal to do with as they wish. Government transfer payments to them add to this amount, while taxes they pay take away from it. Therefore, a more reasonable definition of income would be the following:
Income = Earned Income + government transfer payments – all taxes.
The measure of how equally the GDP is distributed among the population is the Gini index. If it is zero, the national income is completely evenly spread across the population. If it is one, only one person in the entire country gets the entire GDP as income, and no one else gets anything. Therefore, the smaller the Gini index, the more evenly the GDP is distributed across the population. Below are plots of the U.S. Gini index over time. The top two curves are produced by using earned income. They differ because of changes in Census Bureau data-collection methods. The bottom curve uses earned income adjusted for government transfer payments and taxes.

Image Credit: WSJ / Phil Gramm and John Early
After adjusting income for transfer payments and taxes, the Gini index shows U.S. income inequality has actually fallen on average for the past three-and-a-half decades. It is lower now than it was 50 years ago.
As mentioned earlier, leading indicators show the economy is in a very fragile state. It might easily be tipped into a recession by the Biden administration’s new policies.
How Will the Biden Administration Change Our Economic Well-Being?
Professional politicians should be required to adhere to some “truth in bill labeling” rule. Otherwise, they inevitably put a misleading label on a legislative bill, which implies it will do something that most people like. Yet, as with several such bills championed by the Biden administration, the bill would accomplish goals that mostly have nothing to do with the label. Several of Biden’s policy proposals included in such bills would have a catastrophic effect on the U.S. economy. Prime examples are Biden’s proposals for coronavirus relief, disingenuously called the American Rescue Plan; his infrastructure bill, called The American Jobs Plan; and Biden’s proposals for taxes.
The Biden administration’s American Rescue Plan Act has been passed by both houses of Congress and signed into law by Biden. This boondoggle, spending $1.9 trillion over 10 years, was passed without a single Republican vote. It follows $5 trillion in previous federal pandemic “stimulus” spending. Although it masquerades as a COVID-19 relief bill, Republicans claim the definition of COVID relief has been greatly expanded with only 9% of the spending going directly toward COVID-19 relief.
The Democrats, of course, claim they take a more holistic view of what constitutes relief from the epidemic. They asserted the American Rescue Plan should address both the health crisis and the economic crisis imposed by the states’ economic shutdowns. Therefore, Democrats used this excuse to include many items of questionable value that nevertheless would be approved by their supporters. For example, Democrats provided extravagant new benefits to federal workers, teachers’ unions, and debt relief for blue states experiencing a large decline in tax revenues, among many other ill-considered provisions. One of the most odious provisions would prohibit any state receiving benefits from decreasing their state taxes.
Next, let’s consider Biden’s Infrastructure Bill, which is called his American Jobs Plan. It has not yet cleared Congress, but when passed, it would provide about $2.65 trillion over eight years for new “infrastructure.” The dictionary definition of infrastructure is “the basic physical and organizational structures and facilities (e.g. buildings, roads, power supplies) needed for the operation of a society or enterprise.” Infrastructure is government provided physical assets used by everyone. Yet, when I add up the expense of all parts of the bill that clearly do not repair or add to infrastructure, I get $2.26 trillion, or 85.3 percent of the bill’s spending. The non-infrastructure items include such things as investing in electric vehicles; investing in domestic manufacturing, R&D, and job training; expanding home care services; and improving housing, schools, child care facilities, VA hospitals, and federal buildings. Clearly, the vast majority of this bill has nothing to do with public infrastructure. Instead, it is a huge grab bag of progressive projects.
Finally, let us take a brief look at how Joe Biden proposes to change taxes. One of the most important changes would be to increase the corporate tax rate from 21 percent to 28 percent. In addition, Biden wants to return to a worldwide corporate tax regime. In 2017, Trump’s Tax Cut and Jobs Act (TCJA) repealed most U.S. taxes on corporate income earned in foreign countries. This put the U.S. in a modified territorial tax regime that taxed companies only for income earned within the U.S. Biden would like to charge a 15 percent minimum tax on global book income of $100 million or more.
Among all nations, the average corporate tax rate has plummeted from 49 percent in 1985 to 23 percent in 2019. The reason for this tax reduction was an international competition to attract foreign companies to take up residence in their country. Or as leftists would put it, there was a “global race to the bottom” on tax rates. One of the most successful competitors in this “race to the bottom” was the Republic of Ireland. Mostly by having lower corporate taxes and less corporate regulation, Ireland was able to maintain the outstanding growth rates shown below. What is plotted are the 10-year moving averages of GDP growth of several major European nations including Ireland, and of the U.S.

Data Source: The World Bank
Apparently, a “race to the bottom” on corporate tax rates does much for the health of a country’s economy. Nevertheless, the Biden Administration would like to stop this international competition over corporate taxes. If the U.S. raises these taxes while other countries cut them, we can expect many of our companies to leave the U.S. for lower-tax countries. The corporations that stay in the U.S. would be uncompetitive with similar companies in lower-tax jurisdictions.
Recently, Biden’s Treasury Secretary, the former chairman of the Federal Reserve’s Board of Governors, Janet Yellen, said she would work with international organizations to establish an international minimum corporate tax rate. In an April speech to the Chicago Council on Global Affairs, Yellen stated,
Another consequence of an interconnected world has been a thirty-year race to the bottom on corporate tax rates. Competitiveness is about more than how U.S.-headquartered companies fare against other companies in global merger and acquisition bids. It is about making sure that governments have stable tax systems that raise sufficient revenue to invest in essential public goods and respond to crises, and that all citizens fairly share the burden of financing government. President Biden’s proposals announced last week call for bold domestic action, including to raise the U.S. minimum tax rate, and renewed international engagement, recognizing that it is important to work with other countries to end the pressures of tax competition and corporate tax base erosion. We are working with G20 nations to agree to a global minimum corporate tax rate that can stop the race to the bottom. Together we can use a global minimum tax to make sure the global economy thrives based on a more level playing field in the taxation of multinational corporations, and spurs innovation, growth, and prosperity.
Secretary Yellen should be careful what she wishes for. The larger the fraction of GDP taxed and the more that government spends as a share of GDP, the more economic growth will stagnate. More about this below.
What Do All These Changes Mean for the Economy?
So, what does all this mean for the economy? We already know from the coincident indicators that the U.S. economy is currently in pretty good shape. However, we know from the leading indicators that the U.S. economy is also very fragile. In addition, the new Biden Administration seems to be doing everything it can to break that fragile piggy bank.
One very certain fact about the Biden Administration is that it very much wants to increase the percentage of GDP that the Federal Government can allocate and spend. If Joe Biden succeeds in this endeavor, Rahn’s curve tells us economic growth will decrease. Also, the huge increase in money supply required to enable an equally large increase in federal spending (the American Rescue Plan and the American Jobs Plan) will encourage large rates of inflation. Large rates of inflation are always bad for economic growth.
Finally, an almost dispositive case can be made that governments should never tax any company at any time. First, companies are the primary producers of wealth. Every corporate dollar taxed away is a dollar that cannot be used to invest to increase the company’s productive capacity. Second, companies act as conduits of this newly produced wealth, not just to stockholders, but to their employees as well. Every corporate dollar taxed is a dollar that cannot be used to support a new or existing job. It is also a dollar that cannot be used to increase wages and salaries. Without those jobs that companies provide with their wages and salaries, we would all be very poor indeed.
If Biden gets his way to increase corporate taxes, we shall certainly see economic stagnation caused by decreasing production, wage growth, and employment. If you are a progressive who believes corporations are the cause of increasing income inequality, please read Progressives Are Wrong: Income Inequality in the U.S. Is Not Increasing!
Views: 14,798