


The Great Irish Economic Experiment with Capitalism
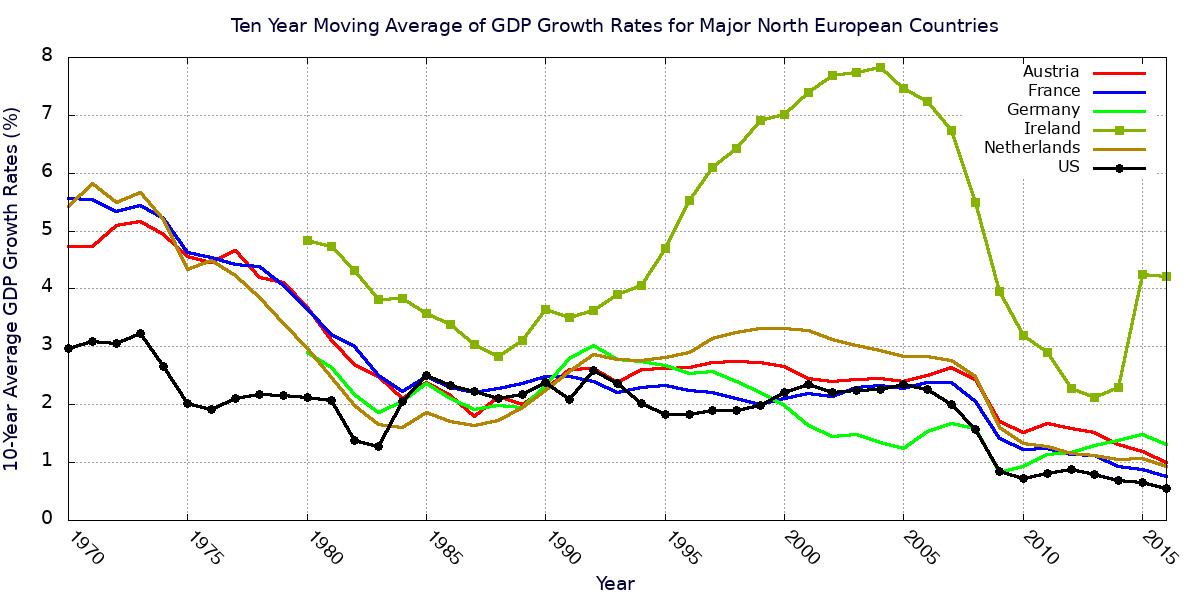
Ten-year moving time-averages of Northern EU countries’ GDP growth rates. All have currently fallen below 2% growth, with the exception of the Republic of Ireland, which in 2016 had 4.2% ten-year moving average growth rate. The actual Irish annual GDP growth rate in 2016 was 5.14%.
Data Source: The World Bank
In my last post I gave evidence that almost all Western nations have falling long-term GDP growth rates. By a long-term growth rate I mean one calculated as a ten-year moving average that tends to average out the business cycle. Yet, as demonstrated by the plot above, there was one country that defied the trend and actually remained high: Ireland. It appears to be a paragon of capitalism. In 2004 its 10-year moving average of GDP growth peaked at 7.83%, and in 2016 it was 4.21%. Its actual yearly GDP growth rate in 2016 was 5.14% according to the World Bank. What accounts for Ireland’s extraordinary growth, and can we copy what they have done?
Ireland: The Great Exception
The very first question we should ask about Ireland is: How much does the Irish government interfere with and manage the Irish economy? The best measure of a government’s control over its economy which I know is the Heritage Foundation’s Index of Economic Freedom (IEF). It is constructed as a straight arithmetic average of 12 subindices or factors, each one measuring a separate aspect of government economic control. Each subindex varies from 0 to 100, so the arithmetic average also varies in the same manner. Whenever a subindex is 0, there is no economic freedom for individuals in that aspect of the economy. What that usually means is government has complete control over that particular part of the economic system. On the other hand, if the subindex is 100, individuals have complete economic freedom with that aspect of the economy, usually meaning government has absolutely no control over it.
Every year the Heritage Foundation calculates an index of economic freedom for every country for which they can find data. A complete explanation for the methodology in constructing the index of economic freedom for a particular country can be found in a PDF here.
In 2018 Ireland ranked number 6 in the world in economic freedom, with the first rank belonging to the country with the most economic freedom (ironically, the Hong Kong SAR of China with an IEF of 90.2).The Irish index of economic freedom was 80.4. As a point of reference, the United States was 18th in economic freedom with an index of 75.7. One is driven to guess there is some aspect of economic freedom the Irish enjoy and that the Americans and other Europeans do not which drives their growth rates above the others. How can we find it?
European and US Scores for Capitalism in the Heritage Foundation Index of Economic Freedom
As a first attempt to discover Ireland’s advantage, let us plot the ten-year moving average of GDP growth of a number of countries with a spread of IEFs. We will do the same thing for the same nations’ IEFs over time. Since the available data for countries’ IEFs are restricted between 1995 and 2018, while we know the averaged growth rates between 1970 and 2016, we will construct both plots between 1995 and 2016. To eliminate obscuring clutter, we will plot the time series for only five countries: the top two freest countries in Europe, Switzerland and Ireland (with 2018 IEFs of 81.7 and 80.4, respectively); the United States with an intermediate 2018 IEF of 75.7; and two countries with lower 2018 IEFs, Austria (71.8) and France (63.9).The plot of the selected countries’ IEFs is shown below. The 2018 IEFs are displayed in the legend.

Data Source: The Heritage Foundation
Now, compare the corresponding plot for the ten-year moving average of GDP growth.

Data Source: The World Bank
Immediately, you should be able to see difficulties. Naively, we would expect the order of the curves in the average growth rate plot to be the same as for the IEF plot. If the Heritage Foundation’s index were to perfectly capture the degree to which government policies limit economic freedom, and if the limitations to growth are dominated by the restriction of economic freedom by political design, then the vertical order of the curves in IEF from bottom to top should be the same as the order in the average growth rate plot. However, if you focus your attention between the years 1995 and 2005, the curve for Switzerland in the IEF plot is closely entwined with the curves for Ireland and the U.S. Yet in the lower plot of averaged GDP growths, Switzerland’s trajectory is at the very bottom during the same time period.
The U.S. curves in both plots pose a particular problem. Always above the curves for Austria and France in the IEF plot, the U.S. curve in the averaged GDP plot is either below or intertwined with their curves between 1995 and 2006. After the financial crisis of 2007 and the Great Recession, and throughout the Obama era, the ten-year moving average of U.S. GDP growth rates was constantly below that of Austria and France.
There are several possible explanations for these discrepancies. A progressive would probably loudly proclaim this shows economic freedom has very little to do with economic outcomes; or even worse, he or she might proclaim economic freedom is actually inimical to economic growth. Nevertheless, the IEF is not totally lacking in explanatory power. The averaged GDP growth for one of the two most economically free nations in Europe, according to the IEF, is far superior to that of any other European country — or for the United States for that matter. Also, the order for the curves of Austria and France in the averaged GDP plot, relative to themselves and to Ireland’s curve, are precisely what we would expect from the IEF plot.
In addition, time lag effects might be obscuring the message. After all, each point on the curves of moving time averaged GDP contains effects for 10 years prior to time for which the point is plotted. However, it is impossible to see how this might explain the very low level of U.S. GDP growth relative to the other countries, given the fact the U.S. IEF comes close to that of the two nations with greatest economic freedom throughout the time period plotted.
There are at least two other possibilities, each of which, given the great complexity of economies, is very likely. One is the economic capacity of a nation to produce is much more related to some of the factors making up the index of economic freedom than to others. Yet each factor is equally weighted in a country’s IEF. It is quite possible a country scores poorly in a few factors most important for GDP growth, but scores quite highly in many others to give it an IEF similar to that of a country growing much faster. The second possibility is there exists a flaw in the factor makeup of the IEF.
Why Ireland Grows So Fast and the U.S. Grows So Slow
Let us first look at the possibility some IEF factors are more important for growth than others. In the table below are the values of the various 2018 IEF factors for the selected countries. The names of the factors are highly suggestive of the meaning for their scores, but to see their exact meaning and how they are calculated, consult the Heritage Foundation’s Index of Economic Freedom Methodology page. Also, I should give you the following words of warning. A factor score goes up in most cases where government control of that aspect of the economy goes down; or as in the case of Judicial Effectiveness and Government Integrity, where the government actively supports and reinforces free-markets and capitalism. For example, if one country’s scores in Government Spending and Tax Burden are higher than another’s, it is because that government’s spending and taxes are lower, not higher.
What we are looking for are factors for which Ireland scores much better than the other selected countries, and factors for which the United States scores significantly worse than Austria and France.
| IEF Factor | Switzerland | Ireland | U.S. | Austria | France |
|---|---|---|---|---|---|
| 2018 Index of Economic Freedom | 81.7 | 80.4 | 75.7 | 71.8 | 63.9 |
| Government Size | |||||
| Government Spending | 65.4 | 69.6 | 56.5 | 19.4 | 2.7 |
| Tax Burden | 70.5 | 76.1 | 65.1 | 49.9 | 47.3 |
| Fiscal Health | 95.9 | 80.8 | 54.8 | 81.1 | 60.8 |
| Category Average | 77.3 | 75.5 | 58.8 | 50.1 | 36.9 |
| Rule of Law | |||||
| Property Rights | 84.2 | 80.4 | 79.3 | 83.5 | 84.0 |
| Government Integrity | 82.8 | 87.7 | 71.9 | 73.5 | 65.1 |
| Judicial Effectiveness | 82.1 | 79.0 | 76.9 | 80.9 | 72.7 |
| Category Average | 83.0 | 82.4 | 76.0 | 79.3 | 73.9 |
| Regulatory Efficiency | |||||
| Business Freedom | 75.7 | 81.8 | 82.7 | 75.5 | 80.2 |
| Labor Freedom | 73.9 | 76.4 | 91.4 | 66.7 | 45.0 |
| Monetary Freedom | 85.2 | 87.4 | 78.6 | 83.7 | 81.6 |
| Category Average | 78.3 | 81.9 | 84.2 | 75.3 | 68.9 |
| Open Markets | |||||
| Trade Freedom | 90.0 | 86.9 | 86.7 | 86.9 | 81.9 |
| Investment Freedom | 85.0 | 90.0 | 85.0 | 90.0 | 75.0 |
| Financial Freedom | 90.0 | 70.0 | 80.0 | 70.0 | 70.0 |
| Category Average | 88.3 | 82.3 | 83.9 | 82.3 | 75.6 |
A short perusal of the table shows Ireland to be significantly better than the other selected countries in the following factors:
- Government Spending
- Tax Burden
- Government Integrity
- Monetary Freedom
In addition Ireland had significantly higher scores with Business Freedom, except for the U.S. which beat Ireland by 0.9 points. Also, with the exception of Austria which tied Ireland, Ireland beat out the others in investment freedom. The Irish advantage in investment freedom, when coupled with its strength in Government Spending and Tax Burden, are very significant. I will comment on this further shortly.
The other explanation we seek is just why the U.S. has been so poor in economic growth despite its generally middling-to-good scores in most of the IEF factors. Looking through the table gives us the following factors for which the U.S. is significantly worse than the other four countries.
- Fiscal Health
- Property Rights
- Monetary Freedom
In addition, the U.S. scores are low in both Government Integrity and Judicial Effectiveness, but in both cases the U.S. beats out France.
What the Irish data most strongly suggests is that long-term economic growth is most strongly dependent on low government spending and low taxes, coupled with strong freedoms for individuals and companies to invest. The low government taxes and spending take scarce economic assets away from government allocation and gives them to companies and individuals. A greater freedom to invest then ensures companies and individuals do exactly that.
Ireland has been widely reputed for a very long time as a tax haven. Investopedia.com says of it:
Ireland is referred to as a tax haven because of the country’s taxation and economic policies. Legislation heavily favors the establishment and operation of corporations, and the economic environment is very hospitable for all corporations, especially those invested in research, development and innovation.
Since the year 2003, a single corporate tax rate of 12.5% has been in effect. A higher tax rate of 25% was introduced for passive income, which is income from interest on bank accounts, royalties, or rental income. As a comparison, consider that the average of European corporate taxes was 18.88% in 2016; and until last December the top U.S. corporate tax rate was 35%, which increased to 39% when the average state corporate taxes were added. In 2016, 68.9% of all S&P 500 companies that earned profits — almost seven-tenths — paid taxes at effective rates after deductions above the average European rate.
If long-term economic growth is most sensitive to the Government Spending, Tax Burden, and Investment Freedom factors, what does this say about U.S. long-term growth? To answer this question most accurately would require doing time averages of the IEF factors, but the variations in the time plots of IEF above after the year 2000 are not large, so let us just look at the factor values for 2018.
According to the Heritage Foundation, the period over which the data was collected for the 2018 Index of Economic Freedom was the second half of 2016 and the first half of 2017. The factor scores for Government spending then say that during this period, government in Ireland spent less as a fraction of GDP than that of Switzerland, which in turn spent less than government in the United States. This helps to explain why long-term growth in Ireland was greater than that of Switzerland, which in turn was faster than that of the U.S. However, the scores also show the U.S. spent less than either Austria or France. Why, then, has the ten-year average U.S. GDP growth been significantly less than that of both Austria and France since 2006? And why has the Irish growth been so much greater than Switzerland’s for most of the years plotted? The values of the Tax Burden factors tell essentially the same tale. Taxes as a fraction of GDP in Ireland were smaller than those in Switzerland, which in turn were smaller than taxes in the U.S. However, we again see U.S. taxes being smaller than those of either Austria or France. What can possibly explain lower U.S. long-term growth than that of Austria and France since the beginning of the Obama era?
The U.S. poor score in Fiscal Health, significantly worse than that of any of the other four countries, might be a large part of the explanation. According to the Heritage Foundation’s Methodology page, commenting on the Fiscal Health Factor,
Widening deficits and a growing debt burden, both of which are caused by poor government budget management, lead to the erosion of a country’s overall fiscal health. Deteriorating fiscal health, in turn, is associated with macroeconomic instability and economic uncertainty. …
The score for the fiscal health component is based on two sub-factors, which are weighted as follows in calculating the overall component score:
Average deficits as a percentage of GDP for the most recent three years (80 percent of score) and
Debt as a percentage of GDP (20 percent of score).
The U.S. national debt reached approximately 105% of GDP in the past couple of years. Then, the capital absorbed by interest payments on the national debt, denying that capital to private investment, might well have subtracted a point or two from GDP growth, according to the research of Carmen Reinhart and Kenneth Rogoff.
Nevertheless, there is still another possible explanation for the discrepancy of U.S. IEF being significantly larger than those of Austria and France, yet its long-term growth rates smaller. That explanation has to do with a possible flaw in the way the Tax Burden factor is calculated.
A Flaw in the Index of Economic Freedom?
The problem in the calculation of the Tax Burden factor of a country’s IEF has to do with the equal weighting of sub-factors. The three sub-factors in question are the the top marginal tax rates on corporate income taxes, the top marginal tax rate on individuals and households, and the total tax burden as a percent of GDP. According to the methodology page on the calculation of the Tax Burden factors, “Each of these numerical variables is weighted equally as one-third of the component score. This equal weighting allows a country to achieve a score as high as 67 based on two of the factors even if it receives a score of 0 on the third.” Yet, there is a great deal leading us to believe the weight on corporate taxes should be far greater than that on individual and household taxes. This is because taxes on companies are far more destructive to the economy than those on individuals and households.
There are actually exceptionally good arguments for having absolutely no taxes on companies at all. You can read some of them in the posts linked below:
- Why corporations shouldn’t pay any taxes — zero, zilch, nada by James Pethokoukis on theweek.com
- Corporations Do Not Pay Taxes: They Can’t, They’re Not People by Tim Forstall on Forbes.com
- Why We Should Eliminate the Corporate Income Tax by Megan McArdle on theAtlantic.com
- Cut the Corporate Tax to Zero by Eli Lehrer on nationalreview.com
Some of these articles point out any tax paid by a company must eventually be paid by actual human beings in one way or another. For a company, taxes are simply another cost of doing business like buying raw materials or hiring workers. Most often the tax is passed on to a company’s customers through increased prices. If this is what happens, the taxes paid by the company can end up being highly regressive. If the product sold is a luxury good bought only by the filthy rich, that would be the exception to the rule. Most goods sold are those bought by the poor and middle classes, such as food, clothes, appliances, etc., etc. Passing taxes on through increased prices of these kinds of goods would hit the poor — even if they pay no income tax — and the middle class just as heavily as they would hit the rich.
Even worse happens if the cost of taxes limits a company’s ability or willingness to purchase what it needs in investments, raw materials, intermediate goods, and/or labor. By reducing a company’s ability to produce, taxes can directly decrease GDP growth. By reducing a company’s ability to raise its workers’ wages, taxes contribute to a decline in demand for all goods and services, also causing a decrease in GDP growth. Kevin Hassett and Aparna Mathur, economists with the American Enterprise Institute, have found an increase in corporate taxes causes lower wages; each one percent increase in corporate taxes leads to a drop of 0.5% in wages on average. These kinds of considerations have led the Organization for Economic Cooperation and Development (OECD) to declare corporate taxes to be “the most harmful for growth, followed by personal income taxes, and then consumption taxes.” Boston University economist Laurence Kotilikioff and his colleagues write that completely eliminating the U.S. corporate income tax would generate
rapid and dramatic increases in U.S. domestic investment, output, real wages, and national saving. These economic improvements expand the economy’s tax base over time, producing additional revenues that make up for a significant share of the loss in receipts from the corporate tax.
Because corporate taxes are more of a burden on a free-market than taxes on individuals and households, they should be given a greater weight in the calculation of the Index of Economic Freedom. We know that until last December with passage of the Tax Cuts and Jobs Act, U.S. corporate taxes have been far greater than the 18.88% average found in Europe, even when U.S. corporate tax deductions were taken into account. A reasonable surmise is an appropriate weighting would make the order of curves in the IEF plot, from lowest IEF to highest, to be the same as the order of curves in the plot of the 10-year moving average of GDP growth rates.
Lessons of Capitalism To Be Learned
The lessons from the “Irish miracle” should be obvious. If a country wants to bless its people with a growing GDP and a rising standard of living, it should:
- Reduce corporate taxes to as little as possible. In fact independent evidence suggests there should be absolutely no corporate tax at all. Ireland and its stark contrast with the rest of the West has provided convincing and crushing evidence of the incompatibility of high corporate taxes with high economic growth.
- Minimize government spending as much as possible. The whole point of reducing corporate taxes to a minimum is to allow companies — in conjunction with the economic demand of consumers — rather than government to direct the allocation of scarce economic resources. To give companies the claim checks for these resources (i.e. money) through decreased taxes, while at the same time seizing those assets through increased government spending, would be to work at cross-purposes.
- Maximize the freedom individuals and companies have to invest. Individuals and companies have always been far superior to the government in solving the “economic calculation problem” for their particular pieces of the economy. If this is so, individuals and companies must be given as much freedom as possible to direct their assets.
These empirical lessons should come as no great surprise to readers of this blog.
Views: 2,212