


Governments Should NEVER Tax Companies!
One of the proudest achievements of Donald Trump and the Republicans was the Tax Cut and Jobs Act of December 2017. In fact, many neoliberals would argue governments should never tax corporations at all. In contradistinction, progressives assert corporate taxes should be greatly increased. This conflict almost certainly will be a major fight in the 2020 elections. What is the truth?
The Progressive Assertions About Corporate Taxes
Before presenting the neoliberal argument that governments should never tax companies, let us consider the contrary progressive reasoning.
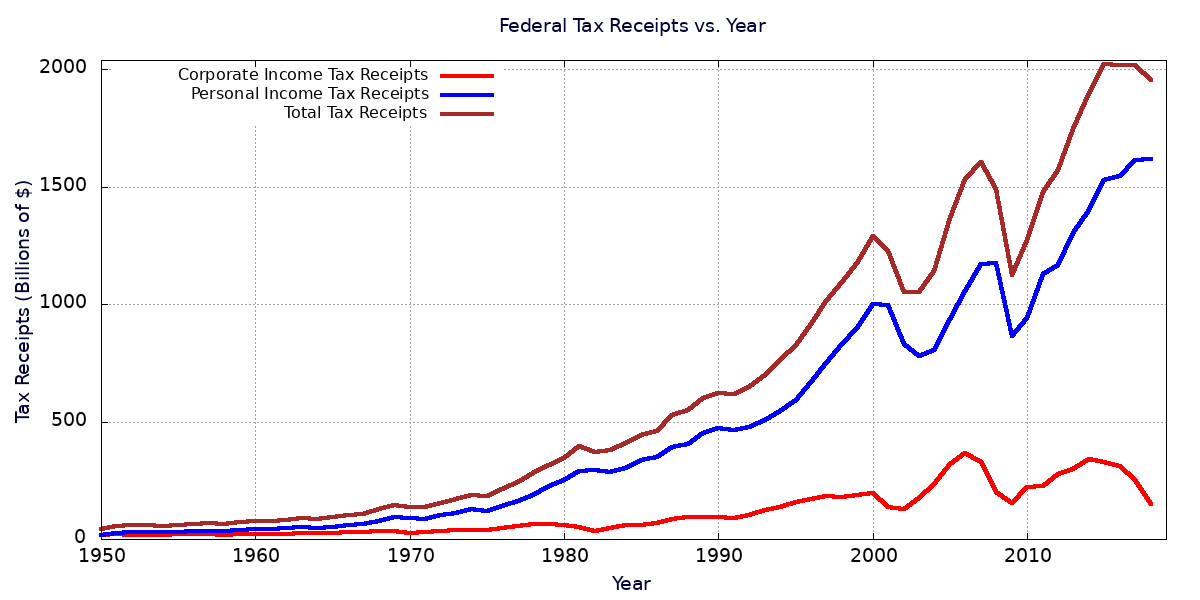
As the theme image at the top of this post shows, corporate income taxes have increased considerably less than individual income tax revenues and total tax receipts. This is among the first assertions progressives make, and it is undeniably true. When we look at tax receipts as a fraction of GDP, we see corporate taxes as a fraction of GDP has actually decreased since the 1950s, while individual income taxes have remained substantially the same.

Data Source: Federal Reserve Economic Database
Progressives claim corporations can and should pay a great deal more to “pay their fair share.” An unspoken, implicit assumption is the increased financing of government programs would actually be useful, and would not be harmful to the economy.
Another frequent and related assertion is the U.S. is out of line with the rest of the developed world. Progressives note the U.S. raises less tax revenue as a percent of GDP than most of our competitors. While this is true, it has not been true because of smaller tax rates, at least before the enactment of the 2017 Tax Cut and Jobs Act. The same implicit assumptions supporting the claim that corporate taxes are too small also undergird this progressive point. Progressives would have us believe the government would employ capital in a more socially useful way than companies.
Another recurring progressive point is that we need to increase taxes on companies to stop budget deficits and halt the growth of our already enormous national debt. According to the Federal Reserve Economic Database, our GDP in 2018 was $20.236 trillion, while our federal national debt was $21.444 trillion. That makes the national debt a humongous 105.97 percent of GDP! At least on the surface, this point seems to make a lot of sense.
A final progressive notion less often heard is hostile to our transition to a territorial tax system for corporations. In a territorial tax system, only corporate income produced in the United States would be taxed. Profits earned in other countries would be taxed only in those countries and would not be touched by the U.S. In a worldwide tax system, the U.S. would tax corporate income no matter where it was earned. Until the enactment of the Tax Cuts and Jobs Act in 2017, the U.S. had a modified worldwide system; corporate income in other countries was taxed only when companies brought that income back to the U.S. What most progressives advocate is a return to a pure worldwide system. Not only would all income be taxed, no matter where earned, but it would be taxed even if not repatriated to the U.S.
What Historical Data Shows Us
We have already seen some historical data that seem to support progressive ideas about corporate taxes. What else can history tell us?
One obvious thought is to see how real GDP growth changes with different fractions of the GDP gobbled up by the federal government. We can see this with a scatter plot using all the data from 1950 to 2015. We plot a point for any particular year with its horizontal position being the tax receipts as a percent of GDP for that year (corporate income tax revenue, personal income tax revenue, and total tax revenue), with its vertical position being the real GDP growth rate. We will plot the points for each tax revenue group with a different color from the others.
What should we expect from such a plot? If tax revenue for a particular group is usually spent wisely by the government to encourage economic growth, then the trend line for that revenue group should have a positive slope with GDP growth increasing with government revenues. If the revenue is not spent wisely, then the trend line for that group should have a negative slope. We have no reason to believe each revenue group would have the same trend line, as the revenues from each group might be spent differently on different kinds of policies. For example, social security taxes — part of total tax receipts but not part of either corporate taxes or individual taxes — are devoted (in theory) to social security benefits.
There is one more expectation we should have. Economies are complicated systems. Many other factors influence economic growth, such as government regulations of many kinds on the behavior of all companies. Other influences are international trade and capital inflows and outflows due to foreign investments and our investments in other countries. The confidence of consumers to buy goods and services is another factor, as is the confidence of corporations to invest in new productive capacity. These are just a few of the many determinants of a year’s GDP growth. As all these factors are constantly changing, we should expect a great deal of scattering of the data points about any trend line.
With that somewhat lengthy introduction, what kind of scatter plot does data from the Federal Reserve Economic Database give us? It is shown below.

Data Source: St.Louis Federal District Bank / FRED
I must admit, this plot was a great surprise to me! Not only did the same line turn out to fit all three groups, but that line is horizontal! One possible meaning is that all other factors determining economic growth are of greater influence than federal tax receipts alone. Of course, government taxes influence a large number of these factors, but there is often a lag time between a change in tax revenues and its influence on those other factors. Because of these lag times, the GDP growth might not reflect changing government revenues until a year or two later. A point’s GDP growth in the plot would then be associated with the wrong tax revenues. Is there another way to dig out the economic results of government taxes?
Since the greatest purpose of taxes is to fund the government’s expenditures, a natural thought is to see how changing levels of government spending affect the nation’s economic health. Below we plot the annualized quarterly GDP growth rates vs total government expenditures as a percent of GDP. This is done for every quarter from the first quarter of 1960 through the third quarter of 2019. In addition, the government expenditures are for governments at all levels. Total government expenditures in Q3 2019 absorbed 38.5 percent of GDP, while total federal government expenditures took up 22.6% of GDP.

Data Source: St Louis Federal Reserve District Bank / FRED
This scatterplot tells us that increased government spending is generally an enemy of economic growth. There is a large degree of scatter about the trend line, just as there was about the plot of GDP growth versus government revenues. This fact emphasizes that there are a great many other factors that help determine GDP growth. Nevertheless, the trend line has a definite negative slope. Also, as total government expenditures exceed 25 percent of GDP, the scatter about the trend line dramatically decreases as government spending plays a greater role in the economy. To increase real economic growth to 4 percent or more, this graph strongly suggests government spending should be limited to around 5 percent of GDP.
The preceding graph is a particular example of what is called Rahn’s curve. It postulates government spending has an optimum level for GDP growth, above which economic growth will generally fall as government spending increases. Again, the graph above suggests that the optimum level for the U.S. is at 5 percent of GDP or less. In fact, the Rahn curve can be shown valid for all developed OECD countries, as shown in a similar plot below.

Data Sources: World Bank and OECD stats.
Yet another set of historical data that teaches a great deal about taxes in general is the data that forms Hauser’s Law. What Hauser’s Law asserts is that no matter what the tax structure is, federal tax receipts will always be within a percentage point or two of 19.5 percent of GDP. As shown in the plot below, this law has been operative in the U.S. since the late 1940s.

Wall Street Journal / David Ranson
This remarkably constant relationship between total tax revenues and GDP has been quite independent of the top individual tax rates, as shown in the graph below.

Hoover Institution / W. Kurt Hauser and David Ranson
Clearly, if you truly want to increase government revenues, you must do everything you can to increase the size of the GDP.
However, this law appears to be very particular to the United States. The reason Hauser’s Law operates in the United States and not in Europe has to do with the highly progressive nature of American income taxes. In 2018 the top 20 percent in income received 52 percent of U.S. total income, but paid around 87 percent of income taxes. The lowest 60 percent received about 27 percent of total income but paid essentially no net federal income tax. Almost all federal income tax revenue comes from the top 20 percentile. This implies that revenue is limited to a fraction of the 52 percent of total income earned by the top 20 percentile. As a fraction of GDP, it is even smaller still. This is because much of GDP is not personal income, but is retained by corporations for investments. The result is Hauser’s Law.
A frequent commenter on this blog once stated he thought Hauser’s Law could be repealed. After all, many European nations tax around 40 percent of national income. Yet to do that, they must levy the maximum tax rate on the lower middle class. To repeal Hauser’s law, the U.S. would have to abandon its highly progressive tax rates and adopt the much flatter taxes of Europe. This does not seem politically possible.
Why Governments Should Never Tax Companies, Especially Corporations
Given the historical data and the progressive arguments about corporate taxes, we are prepared to examine why the progressives are so dreadfully wrong. Not only are they wrong about increasing corporate taxes, but the optimum policy socially would be to levy no taxes on any company. Here are some neoliberal justifications for no taxes on any company whatsoever:
1. Our Focus Should Be On Wholesale Reductions Of Government Spending, Not On Increasing Anyone’s Taxes.
If what we are concerned about is the economic health of the nation, Rahn’s Curve screams out to us we should be totally concentrated on the largest possible reductions in government spending. Rahn’s Curve informs us the optimum level of government spending is 5 percent of GDP or less. Compare that low level with the latest Q3 2019 expenditures of 38.5 percent of GDP for governments at all levels and 22.6 percent of GDP for the federal government.
These facts pose a very real problem because so little of the federal budget is in discretionary spending. Almost all federal spending consists of mandatory spending. Mandatory spending is on auto-pilot and can be changed only by changing laws. As can be seen in the pie chart below, the FY 2019 federal budget gives 62 percent of federal spending to mandatory spending (Social Security, Medicare, Medicaid, interest on the national debt, and other), and 38% to discretionary spending (Defense and all other discretionary). All defense spending accounts for only 21 percent of the budget.

USGovernmentSpending.com / Congressional Budget Office
Moreover, estimates by the Committee for a Responsible Federal Budget guesstimate that the vast bulk of the spending growth between 2018 and 2028 will be in the mandatory categories of Social Security, Medicare, Medicaid/ACA/CHIP, and interest on the national debt.

CRFB.org / Congressional Budget Office
Clearly, with spending and growth in that spending heavily concentrated on mandatory expenditures, an actual reduction in federal spending as a fraction of GDP would require very heavy political lifting. Such a reduction will require politically unpopular steps such as increasing the Social Security retirement age, reducing Social Security benefits, and increasing the maximum individual income to be taxed for Social Security.
2. All Taxes Are Destructive To Economic Growth, And Corporate Taxes Are The Most Destructive Of All.
All government taxes are destructive to economic growth to one degree or another. This is not a surprising statement, given that Rahn’s Curve instructs us that increasing government expenditures would reward us with decreasing economic growth. Individual income taxes reduce individuals’ demands for goods and services. Taxes on corporations reduce their ability to invest in new productive capacity, hire new workers, or raise their employees’ wages and salaries. In addition, governments are notorious for their inability to allocate their tax revenue productively.
Nevertheless, a study by economists of the Organization for Economic Growth and Development (OECD), entitled Tax and Economic Growth, concludes that corporate taxes are found to be most harmful to growth, followed by personal income taxes, and then consumption taxes. The OECD also found corporate taxes are particularly harmful to companies that are in the “process of catching up with the productivity performance of the best practice firms.” In addition, “lowering statutory corporate tax rates can lead to particularly large productivity gains in firms that are dynamic and profitable, i.e. those that can make the largest contribution to GDP growth.” This study used data from all of the OECD countries.
3. Corporate Taxes Contribute So Little As a Percent of GDP, We Might As Well Reduce Them To Zero.
The progressive argument that corporate taxes have grown increasingly smaller as a fraction of GDP and therefore corporations are “not paying their fair share,” can be stood on its head. We know from Rahn’s Curve government expenditures decrease GDP growth overall. We also know from the OECD that taxes in general and corporate taxes, in particular, are harmful to economic growth.
Knowing corporate taxes are harmful even if small as a portion of GDP, we might as well reduce them all the way to zero. Then, we get the “biggest bang for the buck” in the allocation of capital for various uses.
4. Increasing Tax Rates Does Not Increase Government Revenues.
In addition, increasing individual and corporate tax rates most definitely will not increase government revenues in the U.S. With Hauser’s Law limiting government revenues to around 19.5 percent of GDP, the only viable strategy for larger revenues is for the government to adopt growth-oriented policies. The most likely result of simply increasing tax rates would be to decrease GDP growth. Increased taxes would motivate corporations and individuals to move their capital to foreign tax havens. It would also discourage productive investments. By decreasing economic growth, rising tax rates would actually tend to reduce government revenue.
5. Growing GDP Does More To Enhance Social Welfare Than Most Government Programs.
Much of the previous discussion implicitly assumes that encouraging GDP growth does more for the common social welfare than most government programs. In particular, an underlying assumption is that individuals and companies do a much better job allocating capital than governments. Historical evidence that this is indeed true can be found in the following posts:
- Historical Lessons on Economics and Politics
- More Historical Lessons From Europe
- Lessons From The Developing World
- The Human Development Index and Economic Freedom
- Comparing Economies of All Countries on Earth in 2018
The last two posts, in particular, demonstrate countries with the least government control of the economy do the best for their peoples. Countries with the freest economies provide the largest per capita GDPs with more even distribution among the population than for more government-controlled economies. In addition, the most economically free nations provide the greatest life expectancies and the highest average education level.
All the previous points demonstrate the extreme desirability of limiting taxes as much as possible. In particular, corporate income taxes appear to be especially undesirable for the common welfare. That being said, the U.S. would be even more well-advised to reduce government expenditures.
Views: 2,298