


Continuing European Economic Stagnation
Almost two years ago, I produced the plots above as evidence for Western economic stagnation. If anything, the situation for European stagnation is only getting worse. The purpose of this essay is to examine the updated evidence for European economic decay and to discover its causes. This study provides cautionary tales for all countries about what policies should not be followed.
The Evidence for European Economic Stagnation
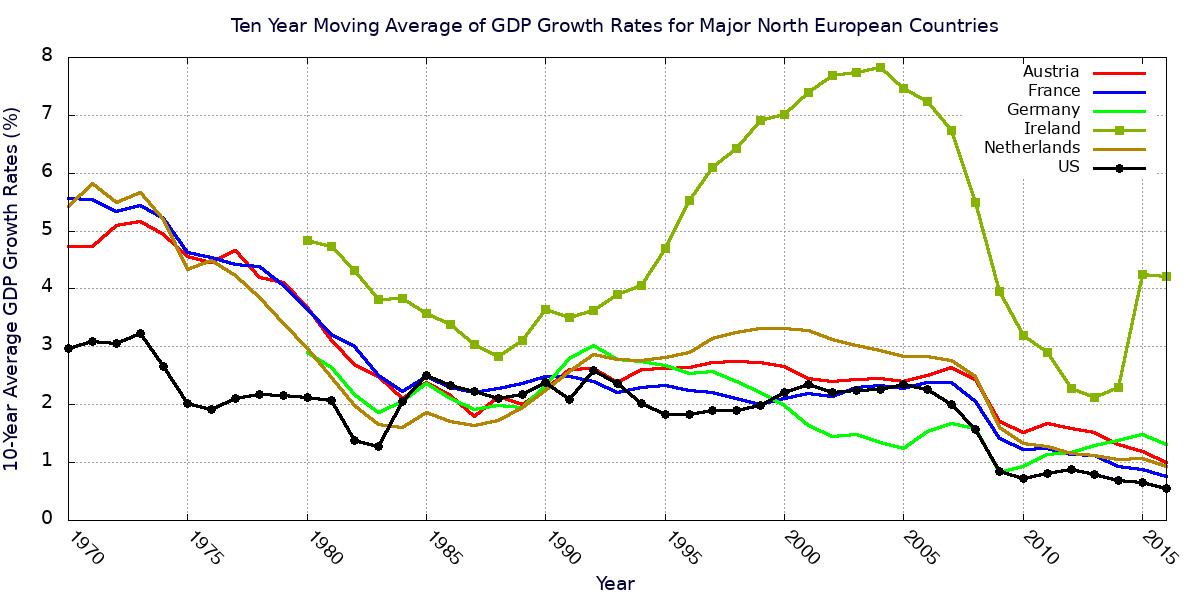
Figure 1 gives plots for the major Northern European nations of a ten-year moving average of their GDP growth rates. To provide a comparison, the plot for the United States is included as a black line with dots at the data points. The graphs only go up to 2016. Therefore, the U.S. plot does not show any influence due to Donald Trump’s economic policies.
The reason for showing the ten-year moving averages is that they average over the business cycle (over economic good times and recessions) to extract the long-term secular growth rates. As a casual perusal shows, almost all the Northern European countries had their long-term growth rates steadily approaching zero. The same was true for the U.S. during the Obama regime, which produced the worst performance of the lot. The only exception is the Republic of Ireland, which has one of the freest capitalist economies in the world. Because of the nature of ten-year moving averages, we will probably not discern much change since 2016 for about five more years.
Similar graphs for the Southern EU countries showed even worse results for them.

Data Source: The World Bank
The Scandinavian countries showed somewhat better performance, but their long-term growth rates were decaying as well.

Data Source: The World Bank
The last three figures accurately portrayed the West European economic condition almost two years ago. What has happened since then? Has Europe continued to stagnate?
In all of the plots that follow, I include data for the United States as reference. First, let’s take a look at economic growth rates. In order to keep the plots from being too busy, I split the plots into three graphs: One each for Northern European, Southern European, and Scandinavian countries. Some countries, such as the Baltic Sea states were not included.

Data Source: the World Bank
Economic growth for most of these nations continues to languish, with the conspicuous exception of the Republic of Ireland. In 2015, Ireland’s growth rate momentarily reached an astounding 25.16 percent. In 2017 and 2018, its growth slowed to a still respectable value just above eight percent per annum. In 2017 and 2018, the U.S. growth rate began to increase again.
Growth for Spain and Portugal among the Southern European nations was similar or better. However, for Italy and Greece, it was significantly worse.

Data Source: the World Bank
Growth among the Scandinavian countries was similar to that of most Western European nations. Over the past three decades, growth rates have drifted downwards.

Data Source: the World Bank
Yet another indicator of economic health is a nation’s unemployment rate. Below is the time evolution of unemployment rates for major Northern European nations from 1991 to 2019.

Data Source: the World Bank
Almost all these unemployment rates are significantly worse than those of the United States. Most are above five percent, with France’s rate hovering around 10 percent. Only Germany currently has a rate (3.2 percent) slightly below that of the U.S. (3.5 percent).
The unemployment rates for Southern European countries are catastrophically worse.

Fig. 8: Unemployment rates for Southern European Nations and the United States between 1991 and 2019.
Data Source: the World Bank
Finally, there are the unemployment rates in the Scandinavian world. The rates for Sweden and Denmark are generally similar to those of most of the Northern European countries. However, at the present time, Norway has a rate only slightly higher than that of the U.S.

Data Source: the World Bank
Clearly, the United States has had much less unemployment than most European countries in recent years.
How about actual economic output per citizen? That is, after all, the bottom line. First, consider GDP per capita for the Northern European nations from 1991 to 2018.

Data Source: the World Bank
With the remarkable exceptions of Switzerland and Ireland, Northern Europeans have been generally poorer than American citizens. Next, consider GDP per capita for Southern Europe. The plots below show Southern Europe is significantly poorer than the U.S.

Data Source: the World Bank
Finally, let’s take a look at the bottom line for the Scandinavian states over the same time period.

Data Source: the World Bank
Finally, we find a group of European nations with higher GDP per capita than the U.S.! Bernie Sanders and Elizabeth Warren would seize on this data to proclaim the superiority of socialism. However, as will be shown in the next section, the Scandinavian countries are far from being socialist nations. Indeed, if one credits Heritage House’s Index of Economic Freedom, Denmark is just as capitalist as the United States in 2019, with Norway and Sweden being only a little less capitalist.
Why Is Europe Stagnating?
Economic outcomes in Europe have generally been worse than for the United States over the past three decades. Why has that been the case? I will present the following hypothesis: Because all large social systems of interacting human beings are chaotic systems, governments interfering a great deal with those social systems cause bad things to happen. And most European nations have interfered with their economies considerably more than the U.S.
Before explaining the ideological reasons for believing the assertion about chaotic systems, let us consider the empirical historical evidence. First, we must demonstrate the degree of government economic domination for each nation. To do this, we will use the Heritage Foundation’s Index of Economic Freedom (IEF). The Heritage Foundation computes every country’s IEF annually for each nation for which there is data. The IEF is constructed to have a value of zero when a country has absolutely no economic freedom, i.e. complete government domination of the economy. It would have a value of 100 if citizens had complete economic freedom with no government influence on the economy.
First, consider the IEF of Northern European nations over time.

Data Source: Heritage Foundation
With the exceptions of Switzerland, Ireland, and the United Kindom, most Northern European countries have had IEFs significantly below that of the United States. Next, examine the IEFs of Southern European nations.

Data Source: Heritage Foundation
These IEFs, particularly for Italy and Greece, are more like those of third world countries than that of developed nations. Finally, consider the time evolution of Scandinavian IEFs.

Data Source: Heritage Foundation
Over time, the degree of economic freedom enjoyed by the Scandinavians has converged with that of the U.S. Essentially, they are just as capitalist as the United States. This refutes Bernie Sanders’ claim that the Scandinavian countries are exemplars of socialism.
Comparisons of figures 12 through 14 with figures 4 through 6 for GDP growth rates, with figures 7 through 9 for unemployment rates, and with figures 10 through 11 for GDP per capita, give us a huge hint: We should look for a connection between economic freedom and those indicators of economic health. Using data points of each country’s GDP growth versus its IEF (economic freedom) for all available years, we obtain the following scatter plot for Northern European nations and the U.S.

Data Sources: the World Bank and the Heritage Foundation
Since these data points include points from years of recession as well as healthy growth, we see a great deal of scatter. However, note that all points with growth greater than 4.5 percent have IEF values of 68 or greater. The same scatter plot for Southern Europe and the U.S. tells us a more ambiguous tale.

Data Sources: the World Bank and the Heritage Foundation
The only country in this plot with data points with an IEF well over 70 is the United States. Since the U.S. is considerably more economically developed than these Southern European nations, one would expect its economic growth to be substantially slower. If you confine your attention to the Southern European nations, you might perceive a trend line for them with a positive slope. The same plot for the Scandinavian countries also provides us with ambiguous results.

Data Sources: the World Bank and the Heritage Foundation
Looking at the correlation between economic growth and economic freedom for each of these groups separately provides an ambiguous picture. However, if we combine them all together, an unambiguous trend line with positive slope appears.

Data Sources: the World Bank and the Heritage Foundation
There is much less ambiguity in the correlation between unemployment rates and economic freedom. Below are the scatter plots for the three European groups and for all of them together.

Data Sources: the World Bank and the Heritage Foundation

Data Sources: the World Bank and the Heritage Foundation

Data Sources: the World Bank and the Heritage Foundation

Data Sources: the World Bank and the Heritage Foundation
Clearly, unemployment drops rapidly as economic freedom increases. If we plot GDP per capita for all European nations, we also see that it increases rapidly with rising economic freedom.

Data Sources: the World Bank and the Heritage Foundation
The outlier data points with GDP per capita above 72,000 constant 2010 USD and IEF between 64 and 75 belong to Norway, which appears to be a special case. Nevertheless, Norway by itself also shows a trend of increasing GDP per capita as economic freedom increases. The blue crosses with GDP per capita between $60,000 and $80,000 and IEF between 76 and 82 belong to Switzerland and Ireland. Referring to figure 12, one sees for most of the years since 1995 that Switzerland and Ireland have had freer economies, i.e. been more capitalist, than the United States.
In addition, figures 1 through 3 show the long-term secular growth rates for the entire West, including the United States, declining almost continuously from 1970 to 2016. The only exception to that sweeping statement is provided by Ireland.
What explains this overall economic stagnation? Figures 18, 22, and 23 show us GDP growth generally increases, unemployment decreases, and GDP per capita increases with rising economic freedom. Figures 12 and 13 demonstrate IEFs for most European countries are either low and steady or are decreasing slowly. Because of the EU customs union, the problems of one country can infect others. The IEFs for the United States fell as well throughout the Obama regime from 2009 to 2017. During the Trump administration starting in 2017, the U.S. IEF has been slowly recovering. Figure 14 shows a convergence of Scandinavian IEFs with each other and the United States starting approximately in 2009.
We can only conclude that most European economies are stagnating because of a slow, widespread loss of economic freedom.
The Reasons Why Loss of Economic Freedom Creates Stagnation
There are two major ways in which countries can weaken their citizens’ economic freedom. The first is when governments dictate to citizens and to private companies the manner in which they can operate. The over-regulation of economic activity by both West European national governments and the European Commission is almost legendary. In particular, the regulation of foreign trade, discriminatory regulation of foreign technology companies, and costly regulation of energy companies to limit CO2 emissions have been especially onerous. The increases in American economic freedom starting with the Trump administration are to a great degree due to partial deconstruction of the regulatory administrative state.
The second way in which governments can decrease economic freedom is by increasing the share of GDP they allocate to their own projects. When governments increase their spending as a share of GDP, they reduce economic freedom in two ways. First, they reduce the ability of individual citizens to demand goods and services themselves. With less demand or demand growth, there is less need to increase production. The second reduction of freedom comes from the loss of corporate assets as they are taxed away. Having less to invest, companies have less ability to increase the nation’s productive capacity.
Our progressive brethren will immediately protest that government allocation of available capital is often necessary and of greater social value than allocation by individuals or corporations. They would have a more persuasive point if government spending were a small fraction of the GDP. However, we can demonstrate using empirical data that all countries of the West are on the declining branch of the Rahn Curve, a model proposed by economist Richard W. Rahn. It postulates there is an optimum level of government spending that maximizes economic growth.

Image Credit: Foundation for Economic Education, fee.org
At extremely low levels of government spending, increased government spending adds to necessary infrastructure, law enforcement, and armed forces. These kinds of expenditures increase the government’s ability to protect the social contract and provide common assets for economic activity. This, in turn, increases the capability of individuals and companies to increase production.
However, once an optimal level of government spending is passed, increased spending actually decreases GDP growth. In part, this is because politicians and government bureaucrats tend to misallocate and waste scarce economic assets. And the reason why government tends to be generally incompetent to solve economic or social problems is that large social systems are chaotic systems. This is especially true for the economy. I discussed the reasons for this in the posts How Is the Weather Like a Country’s Economy? and Chaotic Economies and Adam Smith’s Invisible Hand. When a system is chaotic, perturbations on it will either decay or grow and propagate in unpredictable ways. As a result, government bureaucrats fail to understand all the effects of their policies. The much-lamented law of unintended consequences arises because human social systems are chaotic.
Another reason for decreasing growth is the denial of assets to individuals and companies. For the reasons mentioned in the last paragraph, politicians and bureaucrats tend to waste economic capital. The fruits of private labor are often consumed by governments to create bad effects on society in general and on the economy in particular. Individuals and companies, on the other hand, are focused on their own particular needs and opportunities. They see more clearly how to allocate their own assets most efficiently. Because they are focused on just their small area of the economy, they know how to spend their capital with the least bad side effects for themselves. For this reason, their economic decisions are better able to adapt to the chaotic nature of the economy.
The preceding thoughts give a theoretical explanation for the declining branch of the Rahn Curve. But what does empirical historical experience tell us about the validity of the Rahn Curve? If we plot GDP growth versus government expenditures as a percent of GDP, we obtain the following scatterplot.

Data Sources: the World Bank
The trend line shows that GDP growth tends to decrease as government spending increases. Since data points are shown for all years from 1991 to 2018, data points significantly scatter about the trend line. After all, there are other important factors determining economic growth. These include changes in the availability of commodities and raw materials; changes in people’s confidence about future economic growth; changes in monetary policies; changes in government regulations; and changes in the international trading environment. All of these kinds of changes are not directly affected by government spending, and they create scatter of the data points about the trend line. The fact that any trend line can be found at all demonstrates how strong an effect that government spending actually is. If we restrict our attention to the data in a small number of years during which economic conditions vary only a little, we would expect the scatter about the trend line to be much less. This is confirmed in the next plot.

Data Source: the World Bank
Close examination of figures 25 and 26 shows the negative slopes of the trend lines for both sets of data to be almost identical.
What remains is to see how government spending has changed over the years. Below are the time plots for the Northern European, Southern European, and Scandinavian nations.

Data Source: the World Bank

Data Source: the World Bank

Data Source: the World Bank
For almost all European countries, total government spending has varied only slightly as a fraction of GDP. The only exception is provided by Ireland. Almost all European countries have expenditures significantly higher as a fraction of GDP than the U.S. Of the Northern Europeans, only Ireland, Switzerland, and Germany have recent government expenditures close to that of the United States. Among the Southern Europeans, only Spain has government spending close to the U.S. The Scandinavian countries have government spending significantly higher than the U.S.
Figures 25 and 26 should warn Europeans with government spending high as a fraction of their output that they are paying a high cost in growth. They also pay a price in the social problems created by such a loss in growth. High government spending, together with the loss of economic freedom from government regulations, is a sure recipe for slow national suicide.
Views: 2,966