


Trade War With China: U.S. Economy and Stock Markets, August 2019
Trade war with China has created great corporate uncertainties about the international supply chains of U.S. companies. These uncertainties have caused American companies to pull back from investments to produce more wealth. Nevertheless, the U.S. economy appears to be the best performing among developed economies, and there are reasons to believe a rapid bounceback will occur in the next year.
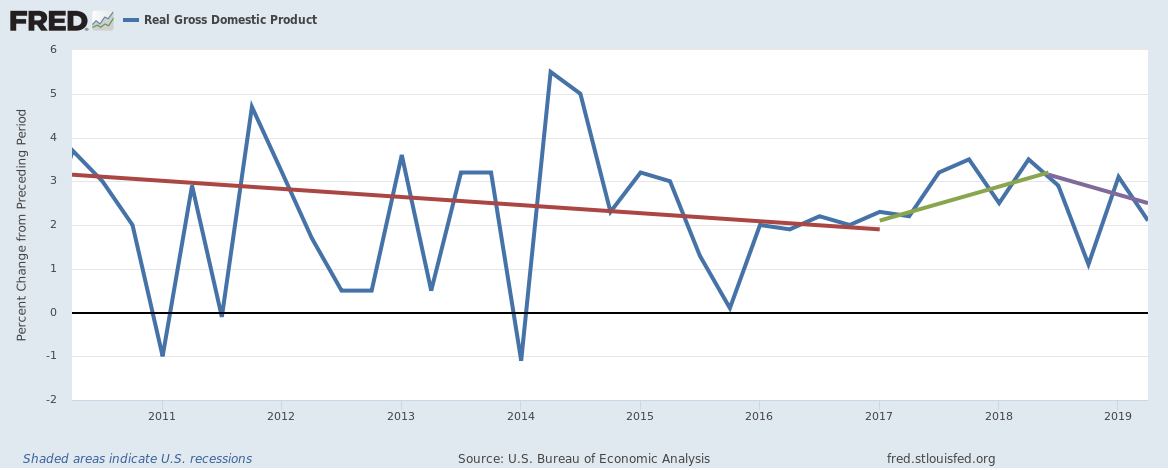
Economic Growth Falters
As shown in the graph above, the trend line for U.S. GDP growth acquired a negative slope during the third quarter of 2018. This was an unwelcome change from the first year-and-a-half of the Trump administration when economic growth was accelerating. This change can not be blamed on increasing unemployment or decreasing real personal income. Both of these indicators have been changing in the right directions for supporting increased domestic demand.
Not only is the U3 unemployment rate continuing to decrease faster than under the Obama administration, but the civilian labor force participation rate has been increasing slowly. You can see this in the two plots below.

St. Louis Federal Reserve District Bank / FRED

St. Louis Federal Reserve District Bank / FRED
More than that, real personal income not counting transfer payments continues to increase. Its growth rate shown below is the growth after inflation is taken out. Also, it does not count transfer payments, such as welfare payments. People obtain this income only by contributing to the economy.

St. Louis Federal Reserve District Bank / FRED
After a long decline during the Obama administration, the growth in real personal income accelerated during Trump’s first year, only to decelerate slightly during his second. Since the beginning of 2019, it is again accelerating.
Given decreasing unemployment, slightly increasing labor force participation, and increasing real personal income, we would expect increasing economic demand for consumer goods and services. This is confirmed for the most part in the plot of retail sales shown below.

St. Louis Federal Reserve District Bank / FRED
After a rapid acceleration in retail sales during the first year-and-a-half of Trump’s administration, there was a sharp decline in the growth rate in the second half of 2018. Since the start of 2019, the retail sales growth rate is again accelerating.
China Trade War Causes Our Faltering Economic Growth
If the slowing of GDP growth can not be explained by reduced domestic demand, what is causing the decline? Two factors seem to be at work. The first is the rest of the developed world is decelerating considerably faster than the U.S., particularly in Europe. To show this, I offer the following plots for three major representative European countries.

St. Louis Federal Reserve District Bank / FRED
The latest available GDP growth rates for Germany (Q1 2019), the United Kingdom (Q1 2019), and France (Q2 2019) are 0.69%, 1.83%, and 1.27% respectively. With world GDP growth markedly slowing, there is less foreign demand for U.S. goods and services. This causes a decrease in U.S. output.
The second and even larger factor is the uncertainties in the minds of American corporate managers about the dangers of international trade war. Doubts about the security of corporate supply chains hurt the most. If an American manager can not count on getting needed imports of commodities, intermediate goods, or final goods, he or she will defensively cut back on needed capital investments. Otherwise, the manager risks wasting capital to produce wealth he or she can not finish for lack of the imports. We can show the growth of this capital investment has fallen recently in several plots. The first of these is manufacturers’ new orders for nondefense capital goods, excluding aircraft.

St Louis Federal Reserve Bank / FRED
The trend for these new orders during the last two years of Obama’s regime (red line) was continuously downward. The trend during Trump’s first year and seven months (green line) was exactly the opposite. However, since July of 2018 capital goods new orders has plateaued.
Another demonstration is provided by the plot of gross private domestic business investment.

St. Louis Federal Reserve District Bank / FRED
Remarkably, not only was the rate of change of business investment declining in Obama’s last two years, but it actually became negative between the fourth quarter of 2015 and the fourth quarter of 2016. Business investment was declining at an annualized rate of -6.47% during Q1 2016. During the first three quarters under Trump, the trend (green line) showed a sharp increase in business investment. After Q4 of 2018 up to Q2 of 2019, the rate of increase, while still positive, has declined.
Clearly, the confidence of business managers has been shaken enough for them to reduce the growth in their investments. Investing less, they increase their ability to produce more wealth much less. This reduces GDP growth. Clearly, the sooner they can feel more confident about their international supply chains, the sooner we can get back to three percent plus GDP growth.
Is a Rapid Bounceback Already In Sight?
There are several reasons for believing our faltering economy will soon regain three percent plus annual GDP growth. The first, as we have already noted, is domestic demand and increased personal income to support that growth continues to be strong. A second reason is many American companies producing product in China are moving their supply chains to originate either in North America or in other countries such as Vietnam. A possible third reason is the economic pressures on China are so intense they will sue for trade peace. This last rationale is the least probable.
Domestic U.S. demand has been emptying corporate inventories faster than companies have produced goods to fill them. This is shown by the inventories to sales ratio plotted versus time below.

St. Louis Federal Reserve District Bank / FRED
There are two different kinds of situations for the inventory to sales ratio to increase or decrease. Which environment we are in depends on whether inventories increase (or decrease) faster than sales, or vice versa. Referring to figure 4, we see that with the exception of the period from July 2018 to January 2019, sales have been increasing in a very healthy manner during the Trump regime. This means people have been buying goods from inventories faster than companies have added to them. Eventually, companies will have to replenish their inventories to ensure timely supply to customers. I did not feel confident in plotting a trend line for the period after September 2018. However the strong suggestion of the plot is we are already in a period when companies must produce more to keep inventories at safe levels. As they produce more, they will increase GDP.
The most important cause of our economic slowdown is our trade war with China. Until recently, China was our number one trade partner in the value of goods imported. China held this top spot from 2015 to 2018. However, Trump’s imposition of import tariffs on Chinese goods has reduced those imports by 12% in the first half of this year. U.S. exports to China fell by 19% as China retaliated with their own import tariffs. Now China ranks third as a trading partner; Mexico ranks first with Canada second. Last May, China backed away from almost all trade concessions they had previously made to the U.S. Contrary to previous concessions, China refuses to change their laws to outlaw theft of U.S. intellectual property; to eliminate forced technology transfers; to stop currency manipulation; and to give greater access to their markets, especially for financial services. So long as China holds these positions, the U.S. will almost certainly continue the trade war.
As serious as the trade war is, our other problems with China are much greater. I commented on this in the post Trade War and Cold War With China. The sad fact is that China has a totalitarian government for which their economy is secondary to their imperial ambitions. The authoritarian ideology of the Chinese Communist Party is reflected in their imperial foreign policies. Ever since the U.S. withdrew from the Philippines in 1992, China has sought to dominate the Far East through control of the South China Sea and the East China Sea. More recently, Xi’s China has unveiled much greater foreign ambitions. These can be seen in two projects: the Belt and Road Initiative and the “Made in China 2025” plan.
The major American motivation for engaging in a trade war should China refuse to abandon its mercantilist policies is not economic. I noted in Trade War and Cold War With China that even the economic reasons for staying out of a trade war are suspect. This is because Ricardo’s Law of Comparative Advantage, the universal justification for international free trade, only works if both trading nations have free-markets. I discussed this fact in the post Trump Becomes More Convincing About Foreign Trade.
However, our major reason for prosecuting a trade war against an intransigent China is to secure our national security. Suppose one trading nation using mercantilist policies makes others economically dependent on it for vital economic resources. Then the dependent nations can be blackmailed for continued access to those resources. Examples of such Western dependencies on China are supplies of steel and rare earth metals. China would like to extend those dependencies to high-end technological products. It seems less and less likely we will be able to come to a satisfactory agreement with China in the near future. The optimal solution might well be to separate the Chinese and American economies totally.
U.S. companies with productive facilities in China, or who otherwise do business with China, are getting the message. In the midst of the intensifying trade war, many companies are opting to leave China, at least to some degree. Over 50 major companies are pulling some portion of their production from China to safeguard their supply chains. These companies include such well-known names as Apple, Google, the Japanese company Nintendo, and Dell. Many companies are reshoring large numbers of jobs back to the United States. They do this not just to escape the tariffs, but also to minimize transportation costs. Such companies include Apple, Boeing, General Motors, and Ford. Other companies like Apple are looking to relocate some facilities to other countries like Vietnam and India.
Wherever they relocate, as long as they get out of China, they will secure their supply chains from the threat of an endless trade war. Once they have that confidence, they will have more reason to invest domestically in the United States.
Our Volatile Stock Markets
Investors have the same problems with confidence in the health of the economy as corporate managers. Just as company executives have a hard time seeing how to manage their supply chains, investors have a very hard time predicting the health of the economy. Every time news suggested the U.S.-China trade war would be settled relatively soon, the stock markets have soared. Every time the news said there are continuing problems between the U.S. and China that may not be solved soon, the markets have tanked. We are currently going through such a panic attack. Over the past three business days (July 31, August 1, August 2) the Dow Jones Industrial Index has dropped 758 points. It opened at 27,245 on July 31 and closed at 26,487 on August 2. Below is a candle chart of the Dow Jones Index openings and closings from April 2017 to August 2, 2019,

Courtesy of StockCharts.com
Below is a similar chart for the Standard and Poor 500.

Courtesy of StockCharts.com
As soon as American corporations secure their supply chains, either through a trade agreement with China or by moving out of China, the stock market gyrations should be greatly reduced.
Views: 2,541