


Economic Optimism Fading
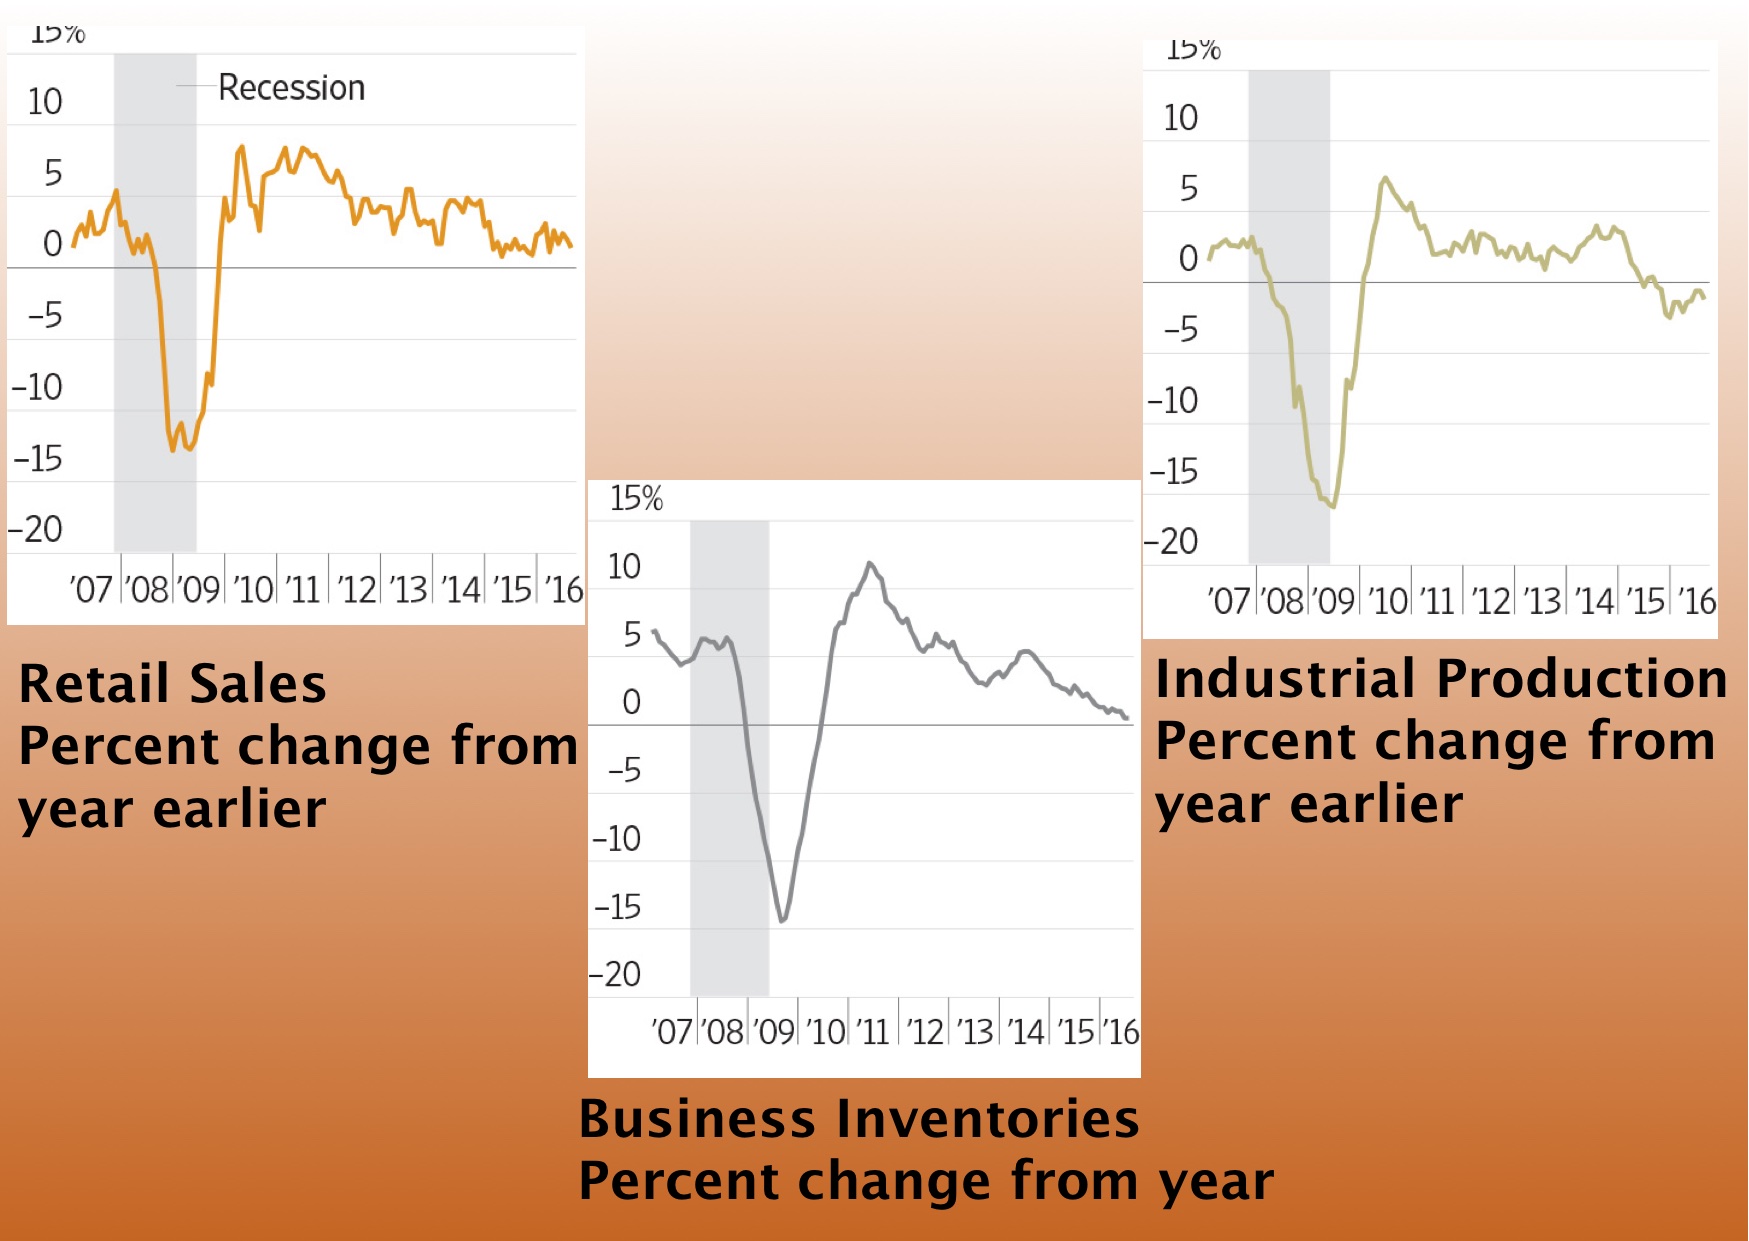
The Wall Street Journal considers these three declining indicators as indicative of continuing economic stagnation.
Wall Street Journal/Federal Reserve District Bank of St. Louis
The Wall Street Journal has just informed us that economic optimism is fading for rising economic growth by year’s end. Thank God! I thought I was going insane as an economic pessimist in the midst of so many optimists! Not that our current secular stagnation is anything but disastrous for our country, of course, and I would much rather have to adjust my personal views of reality to meet new facts than to have our current economic doldrums hurt so many people. Yet, events seem to say no major adjustments to my ideology will be necessary anytime in the near future.
The Grim New Facts
As evidence, the WSJ mostly cites the three declining indicators shown above: The percent change from a year ago of retail sales, industrial production, and business inventories. The WSJ cited falling retail sails, which declined 0.3% in August but declined only 0.1% after excluding auto sales, falling industrial production, and falling business inventories. Most ominous is the decline in retail sales, the growth of which now looks as if it has continued trending downwards ever since 2011. If we magnify the scale by looking at the data from the beginning of 2014, however, you can also see why so many optimists have been hopeful.

U.S Federal Reserve Bank of St.Louis/FRED
Although the big picture of the plot from 2007 to the present shows a linear trend downwards since 2011, the plot from 2014 to the present gave reasons for the optimists to hope. Looking at the record for almost the entire year of 2015, there is no doubt that retail sales had hit a minimum growth rate with a horizontal trend as evidenced by the horizontal maroon trend line. Then the growth rate jumped around December 2015 to what the optimists considered a higher plateau of around 2% growth per annum, as shown by the green trend line. The optimist’s hope was that there would be successive jumps to ever higher plateaus, or even a breakout to ever higher growth.
Of course pessimists like myself saw a completely different picture. Instead, what we saw after the peak in growth in February, 2016 was a decaying oscillation with successive peaks having decreasing amplitudes, as shown by the dashed purple line. What broke the uncertainty of which view was correct was the record of the past three months. The retail sales growth rate declined from 2.42% in June to 1.96% in July, and then again to 1.39% in August, a drop of 1.03% in retail sales growth over three months. If the trend continues, we might well see retail sales not growing at all by Christmas!
What makes this a very big deal, indeed, is that personal consumption expenditures at $12.80 trillion in 2015 accounts for about 70% of the 2015 GDP of $18.04 trillion. Now, economist Mark Skousen points out this is a little misleading, since this leaves out the fact this consumer spending includes all of the company investments to produce the final consumer products. At each stage of production of intermediate products to produce the final products sold to consumers, the price paid for the intermediate product must include the cost of all the previous inputs used to produce all the previous intermediate products. At the very end of the chain, the final price paid for the consumer product includes every one of these intermediate costs. If one includes corporate investments as a fraction of the GDP, one should include only that part of consumer expenditures not already accounted for by corporate spending. Otherwise, you would be guilty of double counting. Skousen writes:
Granted, personal consumption expenditures represent 70 percent of gross domestic product, but journalists should know from Econ 101 that GDP only measures the value of final output. It deliberately leaves out a big chunk of the economy — intermediate production or goods-in-process at the commodity, manufacturing, and wholesale stages — to avoid double counting. I calculated total spending (sales or receipts) in the economy at all stages to be more than double GDP (using gross business receipts compiled annually by the IRS). By this measure — which I have dubbed gross domestic expenditures, or GDE — consumption represents only about 30 percent of the economy, while business investment (including intermediate output) represents over 50 percent.
Thus the truth is just the opposite: Consumer spending is the effect, not the cause, of a productive healthy economy.
Nevertheless, even using Dr. Skousen’s better accounting, consumer spending still accounts for about 30% of the economy, and that is still a very big deal.
On the other hand, Dr. Skousen would be much more alarmed by the second of the indicators cited by the WSJ: falling corporate production, which is obviously correlated in a causative manner with corporate investments. As we see at the top of the post, the rate of growth of industrial production has generally been trending downward since June 2010. Indeed, if we scale up the results by plotting them from March 2010 to the present, we again get an interesting eyeful. From June of 2010, when officially we we were at the start of the recovery from the great recession, until June of 2011, the growth rate of industrial production fell from 8.46% to 1.95%, as shown by the maroon trend line. After that, as the horizontal green trend line shows, the growth rate of industrial production hit a long plateau at roughly 2.4% from July 2011 to April 2014. Then, there was a slight jump up to 3.73% in November 2014, from where it fell to -2.64% in December 2015 as highlighted by the red trend curve. The decrease in about a year’s time was -6.37%!

St. Louis Federal Reserve District Bank/FRED
Production growth after the first quarter of 2016 tried to go positive again until June, when it turned around again and started to fall. Currently, it is falling at a -1.05% rate. U.S. industrial production has actually been decreasing continuously since September 2015.
I have one more remark to make about the poor showing of industrial production. Recall Dr. Mark Skousen’s remark from above that “consumption represents only about 30 percent of the economy, while business investment (including intermediate output) represents over 50 percent.” With that in mind, assuming a positive correlation between business investment and industrial production, note the great similarity of industrial production growth during the long plateau between July 2011 and April 2014, estimated at 2.4% by the green trend line, and the average rate of GDP growth between those two dates: 1.97%. This, I would suggest, shows a great deal about the causes of our economic problems. Also note that Obama’s track record on GDP growth (I throw out his first year of 2009, since that was really a legacy from the previous administration, and I average the first two quarters of 2016 to represent the entire year) is an average GDP growth of 2.06%. As is widely noted, Barack Obama is the first U.S. president since Herbert Hoover not to see a single year of 3% GDP growth!
Falling business inventories were cited by the WSJ as a sign of a weakening economy because it was an indication companies do not expect economic demand to have robust growth. “The paring back of private inventories has been a major drag on overall GDP growth for the past five quarters,” says the Wall Street Journal.

St. Louis Federal Reserve District Bank/FRED
Even worse is the inventories to sales ratio, as shown below. As you can see from the red trend line, inventories to sales is trending upwards. Even while paring their inventories, they can not sell the inventory fast enough at prices high enough to reduce their inventory to sales ratio! A very ominous sign indeed!

Image Credit: St.Louis Federal Reserve District Bank/FRED
All of this information is telling us there is no way this economy could be turned around for the better by the end of the year, let alone by the time of the November elections. I would be very surprised if it were at all possible to turn it around in less than a year’s time.
The Effects on the Elections
None of this can be good for Hillary Clinton. She basically would represent a continuation in many ways of the Obama administration’s economic policies, which have put us in the fix we are in. What changes she has publicly supported in her campaign have been changes that would tax everyone, especially companies, a lot more, and to put companies under micromanaging government regulations.
And what of her opponent Trump? While he has no plans to bring entitlement spending under control (and neither has Hillary Clinton), which is by far the single most dangerous economic problem facing us, nevertheless his ideas for cutting taxes and government regulations would be a godsend for the economy. The reasons for companies, especially multinationals, not investing and producing more in this country are because the high taxes and onerous economic regulations make it very difficult to make a profit. In fact, taxes and regulations make it hard for U.S. companies to compete against foreign companies even within the domestic markets. That much of Trump’s economic program at least would be incredibly more positive for the economy than anything Clinton has to offer.
Views: 1,601