


Coronavirus Lockdowns and the U.S. Economy, April 2020
The worldwide pandemic of COVID-19 has replaced the trade war with China as the dominant influence on the U.S. economy. Coronavirus lockdowns are destroying the economy. Not that the pandemic and the China trade war are independent. By being reliant on China for so many products and since China is the origin of so many supply chains, the rest of the developed world has put itself at China’s mercy. For that reason, this post will be as much about national security as about the state of the economy itself.
Supply Shocks and Demand Shocks
Yet, China’s economic imperialism is a more long-term threat. First, the United States and the rest of the world must deal with both the supply shocks and the demand shocks created by the pandemic. This economic crisis is almost unique in the modern world. It has created both supply shocks and demand shocks at the same time. Perhaps the Spanish flu pandemic of 1918 was somewhat similar.
A supply shock is an economic crisis created by the sudden reduction in some necessary good or service. The oil embargo by OPEC in 1973 is a good example of this kind of economic shock. A demand shock is a crisis caused by a sudden reduction of demand for goods and services. The Great Depression of the 1930s is an excellent example of this. Of course, a demand shock would eventually create a lack of supply and vice versa.
The economic “lockdowns” by governments to limit the spread of the disease have created simultaneous supply and demand shocks. The demand shocks on almost everything produced were created by furloughed or laid-off employees’ loss of income. Concurrently, shutdown industries ceased producing their goods. Some of this can already be seen in coincident and leading economic indicators.
In fact, these economic shutdowns can be found worldwide. One of the first of the supply shocks to be felt internationally was caused by China’s lockdown of their economy. As dependent as the West has become on China, innumerable supply chains feeding the West that started in China were disrupted or stopped altogether. In turn, nation after nation locked down their economies to further disrupt supply chains.
In the United States, the Coronavirus Aid, Relief, and Economic Security Act (CARES) aimed to solve the demand shock problem for some individuals and companies by giving them temporary income. Nevertheless, unless we can eliminate the supply shocks, individuals and companies financially supported by the government might find very little provided by the economy to buy. To the extent it actually works, CARES will only enable individuals and companies to service their debts and allow them to survive financially. Because CARES drastically increases the money supply at the same time GDP growth is plummeting, we can expect a very big increase in inflation in our near future.
What Economic Indicators Tell Us About the Coronavirus Lockdowns
We are just beginning to see the economic effects of the coronavirus in leading and coincident economic indicators. The coronavirus epidemic started in the United States in February, but it only became a major economic problem in March. With a little less than two months since the epidemic took off in earnest, the economic indicators are only beginning to flash the alarm. Some indicators have not yet been published for March, and some updated quarterly do not show the lockdown effects so far.
Among the twelve leading indicators I am following, seven are bearish, three neutral, and only two bullish Among my seven coincident indicators, six are bearish, none are neutral, and one is bullish.
An example of an indicator that does not show any change because of COVID-19 is the Federal Reserve’s Leading Index for the United States, as shown below.

St. Louis Federal Reserve District Bank / FRED
The declining trend line for 2018 was during the period of maximum trade war uncertainty. Although the following trend line for 2019 was rising, it finishes in February 2020 before the COVID-19 lockdowns took effect.
Another ambiguous coincident indicator is real GDP growth, which FRED shows only up to Q4 2019.

St. Louis Federal Reserve District Bank / FRED
A more accurate picture of future GDP growth is given by the Atlanta Fed’s GDPNow estimate For Q1 2020 real GDP growth. It currently predicts a -0.3 percent decline in GDP.

Atlanta Federal Reserve District
The GDPNow estimate is shown by the golden curve. The more pessimistic blue curve is the Blue Chip consensus.
More up-to-date statistics show a strong economy throughout 2019 up until the time the COVID-19 epidemic started shutting down economic activity. These indicators include the U3 unemployment rate, the labor force participation rate, and retail sales.

St. Louis Federal Reserve District Bank / FRED

St. Louis Federal Reserve District Bank / FRED

St. Louis Federal Reserve District Bank / FRED
Each of these statistics depicts a very healthy economy up until the time the coronavirus hit.
Hyperinflation Coming?
At the same time that state lockdowns greatly reduced the economy’s output, the money supply has ballooned because of the CARES Act. This appears to create the condition of way too many dollars chasing a considerably reduced number of goods. That is the classic prescription for a humongous inflation.
This prediction is based on the fact that the total dollar value of the GDP must equal the dollar value of all economic transactions. That is, if we let T label this year’s GDP in this year’s dollars, it must equal the total money supply, M, times the average number of times each dollar changes hands during the year, V. The variable V is called the velocity of money for that year. Then,

Now, how much each dollar can buy changes from year to year. This phenomenon is called inflation if the amount a dollar can buy decreases, and deflation if each dollar can buy more. Because the value of a dollar changes with time, it is useful to discuss dollar amounts in terms of the constant dollars of some base year. Let the total dollar value of all transactions in constant dollars equal t. The quantities T and t are related by a price index, which we will call P. Then,

The percent change in the price index P is by definition the inflation rate (or the deflation rate if it is negative). [See the PDF here for how price indices are constructed.] Suppose the change in a variable x from one year to the next is labeled Δx so that next year’s value of x is x+Δx. Then the next year’s GDP is

From this equation we can derive the following equation if we neglect percent changes that are quadratic or higher.
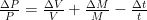
This assumes fractional changes are relatively small. The larger the changes, the larger the errors produced by this equation. Nevertheless, for changes less than 20 percent, it gives a reasonably accurate result. It tells us the inflation rate increases with an increase in the money supply and in the velocity of money and decreases with an increase in real GDP.
Although the equation gives us qualitative predictions, the scale of changes in the money supply and the GDP renders it somewhat inaccurate quantitatively. The increase in the money supply due to the coronavirus relief bill is roughly $2.2 trillion, or 10.2 percent of the $21.5 trillion GDP and 14.2 percent of the $15.5 trillion M2 money supply at the beginning of March. The reduction in GDP in the second quarter has been estimated by Morgan Stanley to be as much as 30 percent. What happens if this reduction persists over several quarters? Depending on how long state economic lockdowns persist, we could easily find ourselves in the midst of economy-destroying hyperinflation.
There are too many uncertainties to make any predictions about how much the COVID-19 pandemic will cost us. Encouragingly, some states are beginning to relax their shutdowns of some of their businesses. However, whether or not these relaxations continue depends on whether or not the epidemic resurges. There is increasing evidence (see here and here and here and here) that a very large percentage of people infected by COVID-19 show absolutely no symptoms. A British Medical Journal study shows as many as 78 percent of the infected are asymptomatic. If this is accurate then the coronavirus is far less deadly than has been portrayed. Any resurgence of the disease because of the end of business shutdowns might be very limited.
Views: 3,027
Charles, When is your book coming out summarizing all these posts?
Good question, Jon! Right now, I have a very long list of required things to do. At the beginning of 2019, I had to get a new Macbook Pro. My old one was a 2008 Macbook and was so outdated that it could no longer receive Mac OSX updates. However, this had a number of unfortunate side effects. One was that my old Microsoft Office could no longer be used on the new computer. I had to buy the latest version of Office, which could not use the old math editor output in my old Word files. Much of the… Read more »