


The Japanese Economy is Stalling Out
Shinzo Abe, Prime Minister of Japan
Wikimedia Commons/US Embassy, Tokyo
From the Wall Street Journal we learn that Japanese economic growth nearly sputtered out in the second quarter of 2016. Their exports are falling and, just like the United States, they are suffering from weak corporate investment. That is not terribly surprising, since they have been using the same Keynesian ideas to direct their policies as the United States. What is surprising is how faithful the Japanese have been to Keynesian doctrine in the face of the unremitting bad results of their policies.
Japanese Economic Policies and Their Results
In fact, Japan invented and pioneered the monetary policy of Quantitative Easing (QE) beginning in March 2001. By pumping money into the economy, the Japanese believed they could stimulate GDP growth. Like Keynesians everywhere, the Japanese central bankers believe zero inflation is bad for economic growth. This comes from their belief in the Keynesian Phillip’s Curve, at least for the short-term before inflationary expectations become ingrained. This is a curve that posits an inverse relationship between unemployment and inflation, so that as inflation increases, the unemployment rate falls. The central bank then opens up the money spigots to increase both inflation and economic demand. The fly in the ointment is that as people begin to expect more inflation, the Phillips curve shifts so that at a given rate of inflation, the unemployment rate rises. As an example of what causes the Phillips curve to shift, workers expecting increasing inflation would require an inflation adjustment to their wages every year.
The Japanese expectation was that as inflation rose, GDP growth would be stimulated by increased demand, which would bring down the unemployment rate. Unfortunately for the Japanese, this attempt to stimulate the economy did not bring increased GDP growth, and did not even bring the expected inflation. This is evidenced by the WSJ’s bar chart of Japanese GDP growth shown below.

The Wall Street Journal/Japan’s Cabinet Office
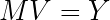
The fact that inflation did not raise its ugly head is demonstrated by the plot of the Japanese inflation rate in the FRED graph below. This presents a true conundrum, one also experienced by the United States: If the central bank, the Bank of Japan (BOJ), were pumping large amounts of new money into the system through QE, then why was inflation not increasing? Why was there also not a concomitant increase in GDP growth? A very large part of the answer comes from the inflation equation, which I demonstrated in The Federal Reserve and Monetarism. If P is a price index like the Consumer Price Index (CPI), M is the amount of money in the economy, V is the velocity of money (the average number of times a dollar is exchanged in a year), and y is the size of the GDP in constant dollars, then it can be shown that

The Greek deltas, Δ, indicate a change in a quantity, and are defined in such a way that they are positive if the quantity increases. The percent change in the price index, 100% ×ΔP/P , is the inflation rate if ΔP is positive and the deflation rate if it is negative. Now, because of QE, we are thinking about a situation where the fractional change in the money supply, ΔM/M, is large and positive. If everything else on the right hand side of the equation remains the same, we would have to obtain a positive inflation rate, as expected by the Keynesians. The Keynesians also expected an increase in the fractional change in the GDP, Δy/y, but as demonstrated in the WSJ’s GDP bar chart, the quarterly changes have been recently small and often negative. The annual averages have been generally close to zero.

Data courtesy of the Organization for Economic Co-operation and Development (OECD)
Image Credit: St Louis Federal District Bank/FRED
So here Japan is with a generally small-to-moderate inflation rate on the left hand side of the equation, and a very large fractional increase in the money supply and a small increase in the fractional change in the GDP on the right hand side. The only quantity left to balance both sides of the equation is the fractional change in the velocity of money, ΔV/V, which must be negative to balance the large increase in the money supply!
Uncharacteristically for the Federal Reserve Economic Database (FRED), they did not have any direct data on the Japanese velocity of money. However, the inflation equation above is derived from an even more fundamental equation that can be regarded as the definition of the velocity of money.
The capital Y in this equation indicates the GDP in current dollars. We then have V=Y/M for the velocity of money. Using this equation we can construct Japan’s velocity of M2 money from data on FRED.

Data courtesy of Japan Cabinet Office.
Image Credit: St. Louis Federal Reserve District Bank/FRED
As expected, the velocity of Japan’s money is steadily decreasing with time. This is exactly the same as with the recent monetary history of the U.S. What a decreasing money velocity means is that money is increasingly staying in people’s pockets, rather than being exchanged for goods. This is exactly the opposite of what central banks have been trying to accomplish. Rather than encouraging people with low interest rates to borrow money and spend, somehow the easy money policies have been doing exactly the opposite. In an interesting article on this phenomenon at the Forbes website , Protecting Yourself From Japanese Insanity, James Gruber writes,
What declining velocity of money suggests is that banks are sitting on excess money because households aren’t willing to borrow as they’re busy paying down debt. Meanwhile businesses, which are less indebted, aren’t confident enough in the economy to borrow money and invest it.
For other reasons why people and companies are discouraged from spending, take a look at Why Have ZIRP and QE Failed?.
Albert Einstein’s Proof of Insanity?
One of the most interesting aspects of all these observations is this question: Why do central bankers continue to double down on failed policies? The ladies and gentlemen who are central bankers are very bright and knowledgeable people. Surely they can see that repeating past, failed policies will only give them more of the same?
I have very similar questions and concerns about political progressives in the United States. I know for a fact that almost all whom I meet (more than 50% of my friends and acquaintances are progressives) are very bright people. Can they not see their policies are wreaking economic and social havoc? Certainly it must be obvious to them, as well as to anyone else who looks at federal government spending, we are rapidly reaching the time (within one to one-and-a-half decades) that every single penny of federal revenues will be absorbed by paying for the mandatory entitlement spending and for interest on the national debt. Already about 2/3 of federal spending is being gobbled up by the entitlements!
Yet despite many past failures, these brilliant, good (at least most of them!) people would continue to repeat demonstrably failed policies. Albert Einstein is often reputed — apparently apocryphally — to have said that insanity is doing the same thing over and over, and expecting to get a different result. If Einstein did not say this, he should have!
Views: 2,764
Being 85, I modestly intervened with another MSc Eng in the 50’s debate between Cambridge Economists and Irving Fisher’s followers about how to write properly the latter’s money equation. Finance, the daughter science of Economics is a much younger science than Physics and it was obvious that, by hazard or design, the Money Circulation Equation is formally identical to the equation of ideal gases: PV=RT in which P is the gas pressure V its volume T its temperature R a constant to make the previous variables dimensionally homogeneous, a basic requirement of physics (unfortunately, not of finance) Physicists are well… Read more »