Is the US Economic Boom Sustainable?
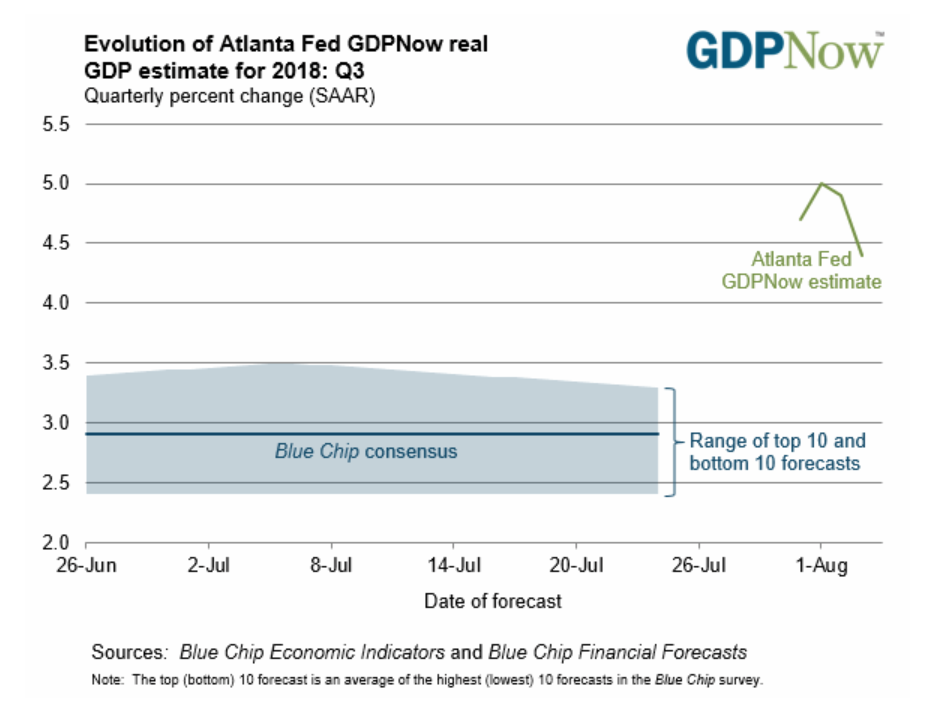
Evolution of the Atlanta Federal Reserve’s GDPNow estimate for real GDP growth in Q3 2018. The current estimate for Q3 growth is 4.4 percent.
Atlanta Federal Reserve District Bank / GDPNow
American progressives are in a very tough spot. For decades they have argued the federal government must thoroughly regulate corporations. Government was needed to maintain a healthy economy, and to curb the predatory instincts of private enterprise. Yet, now that we have a president whose policies are the exact opposite of what they prescribe, the economy is suddenly booming. The economy has not been this good in more than a decade. How are progressives to explain away how Donald Trump’s free-market policies are working? They must find the stark contrast with Obama’s bad results unnerving and alarming.
Progressive Explanations
There are at least two progressive narratives to explain the economy’s embarrassingly good health. One of them is rather interesting, and one is blatantly false. Let’s look at the interesting one first.
The interesting narrative is that our currently healthy economy is merely enjoying a “sugar high.” Larry Summers, the Keynesian economics professor, started this meme at the beginning of Trump’s administration, and updated it last December. In his update Summers declared
Unfortunately, the best available evidence suggests that signs of current market and economic strength are largely unrelated to government policy, that the drivers of this year’s economic strength are likely transient and that the structural foundation of the U.S. economy is weakening. Sugar high remains the right diagnosis, and tax cuts are very much the wrong prescription.
He then noted that although the GDP growth was somewhat faster in 2017 than in Obama’s last year, it still had not accelerated.
Some variations of the “sugar high” story include the following:
- The 4.1 percent GDP growth last quarter was fueled by tax cuts. In time, the deficits caused by those tax cuts will more than undo the good they have done. In addition, tax cuts for individuals are not permanent and will go away in a few years. Progressives believe the tax cuts provided to companies will not be used for productive investments. Instead, they think companies will fritter them away in stock buy-backs and dividend payouts. After all, this is the way companies acted during the Obama years.
- The threat of future large tariff increases has led the Chinese to increase purchases of goods they knew would be more highly tariffed later. As higher Chinese import tariffs take effect, Chinese imports from the United States will fall.
- Some economists argue the economy is bumping into a growth ceiling created by a lack of skilled labor. Already, there are more jobs being offered than there are applicants. In addition, the job skills of applicants are often a poor match for what companies need. Unless productivity per worker rises, which has not occurred in recent years, annual GDP growth will be sharply limited.
- The most often heard story is whatever good the Trump administration has done will be blown away by the hurricane of an international trade war. The prices for both consumer goods and for the materials companies need will rise, choking off the economy.
All variations of the “sugar high” meme posit limitations built into the economy and Trump’s policies that will reverse our 4.1 percent growth, to drop it back to the sub-two percent range to which we had grown accustomed under Obama.
That is the more interesting of the two narratives being offered by progressives. The other, blatantly false narrative is Trump and Republicans are merely inheriting the good effects of Obama’s policies. We have Obama to thank for our economic good fortune. This fable is so obviously false, one finds it hard to believe anyone would try to sell it. All you have to do to debunk it is to consult some readily available data at the Federal Reserve Economic Database (FRED). For example, consider the real GDP growth rate through Obama’s regime and during the first year and a half of Trump’s administration.

St. Louis Federal Reserve District Bank / FRED
Then, there is the leading index of the St. Louis Federal Reserve Bank. It falls with declining economic fortunes, and increases as the economy promises to grow faster.

St. Louis Federal Reserve District Bank / FRED
Next, consider the headline unemployment rate (U3).

Image Credit: St. Louis Federal Reserve District Bank / FRED
Clearly, the unemployment rate has fallen considerably faster in the first year of Trump’s administration than in the last year of Obama’s.
Next, consider the percent change in real personal income less current transfer payments. The fact the income is real means inflation has been taken out. That this growth rate of personal income leaves out current transfer payments means the personal income does not include welfare payments. This income was earned by people producing something in the economy, not by receiving a welfare check.

Image Credit: St. Louis Federal Reserve District Bank / FRED
If Obama’s policies were so wonderful in creating our current economic well-being, then why were the trend lines all declining under Obama for real GDP growth, the Fed’s leading index for the U.S., and for the percent change in real personal income? Why did they suddenly reverse and start rising under Trump? Why did the U3 unemployment rate fall so much faster under Trump than Obama? The claims that Obama really deserves the credit for our present healthy economy are patently ridiculous.
There are other statistics that reinforce the picture I have painted. Because they give evidence on how sustainable high growth rates might be, I will discuss them in relation to economic sustainability in the section below.
What the Evidence Tells Us About Sustainability
So, what are we to make of the arguments of the Left? Their use of the phrase “sugar high” indicates they believe whatever is causing high growth is evanescent and will soon disappear. They believe we will soon go back to the low average growth we experienced under Obama. Some progressives, like the economist Larry Summers, believe the “secular stagnation” we have lived through in the past decade is due to free-market failures. Only government programs and spending can reverse the stagnation according to them.
What caused that secular stagnation, and why did it cease with Trump’s policies? By definition, if there is economic growth, then companies must produce more. Yet to produce more, companies must invest in more productive capacity. This investment might be in providing more or new goods or services. Alternatively, they might invest in more efficient production facilities to produce goods and services at lower cost. What does history tell us about past corporate investments? One readily available measure of corporate investments is manufacturers’ new orders for non defense capital goods.

St. Louis Federal Reserve District Bank / FRED
This statistic is provided by the Federal Reserve in millions of current dollars, seasonally adjusted. It is not in constant dollars. This means the dollars are decreasing in purchasing power with inflation over time. In order for investment in capital goods to be increasing, its rate of growth would have to exceed the inflation rate. With that in mind, consider the plot of its growth rate, year-over-year, below. The red line is the linear trend from 1993 to the end of the Obama administration.

St. Louis Federal Reserve District Bank / FRED
Note that over this period new orders for capital goods has been trending downwards. This is the most fundamental explanation for our past secular stagnation. Companies have not been investing enough in the U.S. to create strong growth. Why?
One often heard explanation is that U.S. corporations have invested in foreign production of both goods and services because of much cheaper overseas labor. In the process they have “off-shored” a great many good-paying jobs. In addition, many former U.S. companies removed themselves from the United States altogether, becoming foreign companies through the process of “corporate inversion.” High U.S. corporate taxes (higher than in Europe until last December), coupled with crippling and rapidly increasing government regulation of companies, created extremely difficult conditions for companies to make profits. Is it any wonder corporations have removed production and productive capacity from the U.S. to where it is easier to earn profits? Is it any wonder small companies have been slow to form in such an environment, and quick to go out of business?
If a decades long accretion of government economic regulations and increasing taxes is a correct diagnosis for secular stagnation, then reversing course should begin to reverse that stagnation. This is the fundamental assumption underlying Trump’s neoliberal policies. From the very beginning of his administration, he has been deconstructing some of the worst aspects of the regulatory state. Then, last December, he and the Republicans greatly reduced corporate tax rates. They also began the process of converting the U.S. tax system for companies from a world-wide to a territorial system. In addition, the Tax Cut and Jobs Act of December 2017 reduced middle class taxes as well. However, the most important aspect of the tax reform act as far as the health of the economy is concerned is the reduction of the tax burden on companies of all sizes.
The result has been what progressives characterize as a “sugar high” for the economy. Yet, is that a correct characterization for an economy that is encouraging rising corporate investment in productive capacity? What can stop economic growth when companies are incentivized to invest productively? To produce more, companies must hire more skilled labor from a limited labor pool. Inevitably, companies will compete for this limited labor supply, causing wages to increase. These rising wages will not be inflationary because they are supported by increased wealth production. The rising wages will then generate increased demand for the new goods. As long as companies continue to invest productively, the entire process will be self-sustaining.
As you can see in all the plots above, the economy is strongly responding to the new incentives and deregulated environment. At the very top of this post is a time plot of the Atlanta Fed’s GDPNow statistic, which is their best estimate for the current quarter’s GDP growth. Right now, it stands at 4.4 percent for the third quarter. The first estimate for the Q2 2018 growth was 4.1 percent. Should Q3 growth end at the current estimate and the Q2 estimate does not change, then the average over the past four quarters will be 3.25 percent. The latest U3 unemployment rate for July 2018 was 3.9 percent. The U.S. economy rarely gets better than that.
What Is the Economy’s Prognosis?
For the short term over the next year or two, most of the signs seem to indicate a healthy growing economy. Nevertheless, our economy faces at least two major threats.
The most immediate is the possibility of an international trade war. In the posts How Probable Is a Trade War With China?, Do We Need Tariffs To Attack Foreign Trade Problems?, Trump Becomes More Convincing About Foreign Trade and U.S. Economy and Stock Markets, July 2018, I noted how the most likely trade war opponents in Europe and China are weaker economically than the U.S. and have a lot more to lose in a trade war. Also, Trump and his advisors have made clear they are not threatening higher tariffs for mercantilist reasons. Instead, they are using the threatened tariffs as a bludgeon to get our trade-partners’ attention to how bad their own tariffs are. On July 25, President Trump met with European Commission President Jean-Claude Juncker. At that meeting they agreed to postpone any trade war between the EU and the United States. Encouragingly, they also agreed what they should work toward was a trade environment with tariffs set to zero, no non-tariff trade barriers, and no government subsidies for private companies. In addition, they agreed the EU should buy more American soybeans and liquified natural gas. The prognosis for the renegotiation of the North America Free Trade Agreement (NAFTA) is more guarded, with a final solution delayed at least until after the midterm elections in November. That leaves China as the biggest problem.
The other problem is more long-term, although it is seriously affecting us now. This is the question of how to increase available skilled labor of the kinds needed by the economy. American schools are demonstrably failing to fulfill this need. Moreover, merely throwing more money at school systems seems not to have made any great improvements. This is a complicated, multifaceted problem and will almost certainly take a long time to solve. If the public school system can not solve it, American businesses might attack the problem themselves through apprenticeship programs.
The Trump administration and the Republican Congress have removed many of the disincentives for companies to invest, hire, and produce. Much more can be done, particularly in removing more of the administrative state. Middle class tax cuts in the Tax Cut and Jobs Act should be made permanent. Yet, if government does not backtrack on progress already made, GDP growth of more than three percent — perhaps much more — appears sustainable.
Views: 2,217


