


U.S. Economy and Stock Markets, May 2017
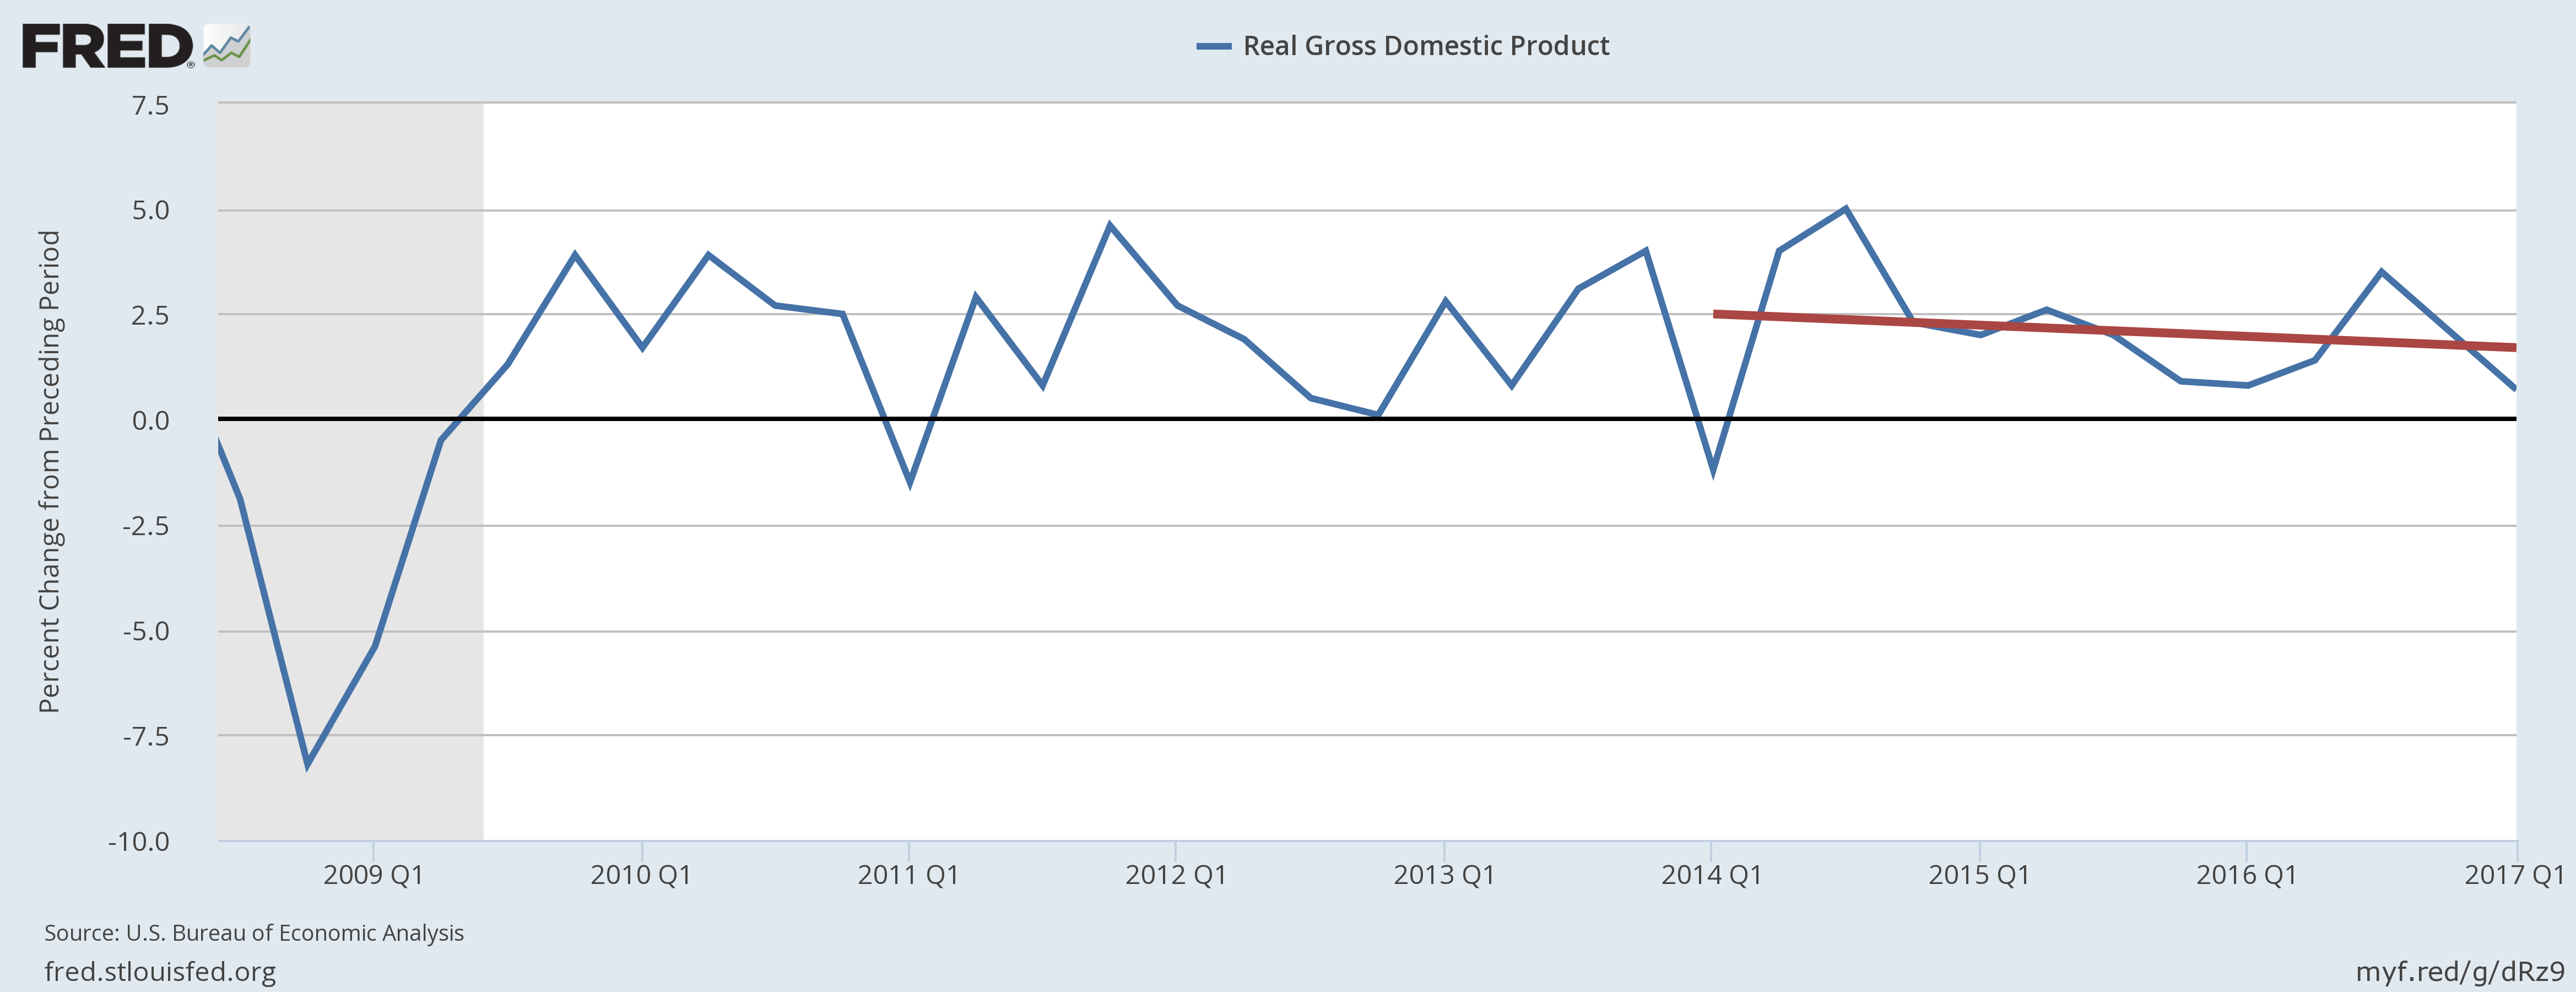
Alas! Real GDP growth is still trending downwards.
Data and Image credit: St. Louis Federal Reserve District Bank / FRED
It is now time to take our periodic look at how the U.S. economy fairs. My last survey was last February, with my tardiness in making a new one due to a hope that the new Trump regime would cause something new to happen in the economy. Although there are indeed new signs for hope, nevertheless the new administration’s biggest economic ambitions still await fruition. Given the true enormity of the political and economic problems, I suppose it could be no other way.
What the Economic Statistics Tell Us
As is usual with these economic updates, I have simultaneously updated my coincident and leading economic indicators pages. Please consult those two pages for comments on each of the individual indicators. Among my six coincident indicators, one was bearish, two were neutral, and three were bullish for an overall coincident score of +2 bullish. Of the twelve leading indicators, three were bearish, five were neutral, and four were bullish for an overall leading indicator score of +1 bullish. Both sets of indicators are telling us that at least something is changing for the better in the economy.
Nevertheless, whatever is improving in the economy is not showing up yet in the bottom line of U.S. GDP growth. As you can see from the plot of U.S. real GDP growth above, it is still trending downwards with the first quarter 2017 annualized GDP growth being only 1.2%, which is vanishingly small with the error bars almost certainly straddling 0% growth.
So what is causing the improvement in the indicators, and is that improvement ephemeral? Let us first take a look at those leading indicators showing improvement, beginning with the St. Louis Federal Reserve District Bank’s own Leading Indicator for the United States.

Image Credit: St. Louis Federal Reserve / FRED
The blue curve shows the Leading Index from January 2014 to March 2017, with the heavy green line being the linear trend between December 2014 to the election of Donald Trump in November 2016. Clearly, the green line mirrors the long U.S. economic decline suffered during Obama’s administration. After Trump’s election the Fed’s Leading Index rose somewhat, if tepidly, and oscillated. At least the long decay was interrupted.
Why should the long decay have been interrupted? A hint is provided by the plot of total manufacturing employees versus time.

Image Credit: St. Louis Federal Reserve District Bank / FRED
What this plot shows us is that after recovering from the Great Recession, the growth rate of manufacturing jobs saturated in January 2015, falling fairly consistently until the election of Trump, after which manufacturing jobs rose significantly.
Yet another hint is provided by manufacturers’ new orders for non-defense capital goods, which is a measure of how much corporations are investing in their productive capacity.

Image Credit: St. Louis Federal Reserve District Bank / FRED
Again, we see corporate investment falling through much of Obama’s second administration, only to be revived around the time of Trump’s election. Since President Trump has not yet had a lot of time to actually do much, one begins to suspect that psychological expectations of what his administration can do in the near future have a lot to do with the turn-around. That is not the only explanation, as I will discuss in the next section, but a change in national psychology leading to greater economic activity has to be high on the list of possible causes.
We see the phenomenon again in the prices of copper and copper products. Because of its importance to electrical wiring and manufacturing. the price of copper will increase as economic activity increases.

Image Credit: St. Louis Federal Reserve District Bank / FRED
Among the coincident indices, we can see the slight revival set off by Trump’s election in the Fed’s Coincident Index of U.S. Economic Activity.

Image Credit: St. Louis Federal Reserve District Bank / FRED
The influence of Trump’s election can also be seen in the average monthly change of the Federal Reserve’s Labor Market Conditions Index (LMCI).

Image Credit: St. Louis Federal Reserve District Bank / FRED
The heavy red line is the linear trend in the monthly change in the LMCI from January 2014 to the election of Donald Trump. It shows the consistent decay in labor market conditions during Obama’s last administration, to be interrupted only by the advent of Trump.
What all this suggests is that something to do with Trump’s election has caused companies to invest more, hire more, and produce more. What could that something be?
What the Republicans Have Done So Far, and What They Have Not
So what have the Trump administration and the Republican Congress done so far that could actually make a difference? The two most important accomplishments that could turn our economic fortunes around, tax reform and Obamacare repeal and replace, so far eludes the Republican Party. Nevertheless, there is still a great deal President Trump can do to better our fortunes through presidential executive orders. In addition, just by making companies believe that the new administration will make it easier for them to make a profit, Trump can inspire increased investment and economic activity.
Even though the major parts of the Republicans’ economic legislative program have still not been enacted, Trump has already accomplished much from executive orders. A list of some of the more important of these are as follows:
- “Executive Order Minimizing the Economic Burden of the Patient Protection and Affordable Care Act”: This order instructs federal executive officers to minimize the economic burden of Obamacare on citizens and companies until it can be “repealed and replaced”. The Secretary of Health and Human Services and other federal officers are instructed to “waive, defer, grant exemptions from, or delay the implementation” of any part of the law that places a fiscal burden on the government, businesses or individuals. This includes waiving the individual mandate.
- “Expediting Environmental Reviews and Approvals for High-Priority Infrastructure Projects”: This order directs that environmental reviews of “high priority” infrastructure projects (roads, bridges, airports, highways, oil pipelines, etc.) be expedited.
- “Reducing Regulation and Controlling Regulatory Costs”: This order is a direct attack on the progressive regulatory state. It requires that before an executive department or agency can propose a new regulation, they must eliminate two. In addition net changes to regulatory costs must be less than or equal to zero dollars, with any new regulatory costs offset by reductions from eliminated regulations.
- “Restoring the Rule of Law, Federalism, and Economic Growth by Reviewing the ‘Waters of the U.S.’ Rule”: A herald for a major revision of Barack Obama’s Clean Water Rule, this order instructs the EPA and the assistant secretary of the Army for Civil Works to propose a new rule that either eliminates or revises Obama’s rule. The current Clean Water Rule has been widely interpreted as a federal power grab to gain jurisdiction over the use of water on farmland, or even its existence as puddles in your backyard or in drainage ditches.
- “Promoting Energy Independence and Economic Growth”: This is another order to the EPA to review and replace another Obama executive order instituting a Clean Power Plan. Obama’s Clean Power Plan was aimed at reducing American carbon dioxide emissions into the atmosphere by gradually making the use of fossil fuels uneconomic. This is despite the fact that atmospheric carbon dioxide concentrations are now dangerously low for the continued existence of life on Earth. Trump’s order asks federal departments and agencies to review any regulations that could “potentially burden the development or use” of fossil fuels or nuclear energy.
- “Identifying and Reducing Tax Regulatory Burdens”: This order directs the Secretary of the Treasury to make a review within 60 days of April 21, 2017 of all tax regulations created in 2016 and 2017 that put an “undue financial burden on United States taxpayers.” Then within 150 days the Secretary must submit a plan alleviating “the burden imposed by regulations” identified by the review.
This collection of executive orders should significantly decrease the burden of the federal government on economic activity. In doing this, they will increase the expectations of both companies and consumers that economic growth will again increase, encouraging everyone to increase their economic activity. Nevertheless, how much of this increased activity is justified by the objective effects of Trump’s executive orders, and how much is inspired by expectations of even more? If Trump and the congressional Republicans are not successful in producing tax cuts and reforms, and if Obamacare “repeal and replace” is not achieved, will all the economic improvements be fleeting?
The Verdict of U.S. Stock Markets
The judgement of the stock markets to the new Republican regime has so far been extremely positive. The recent time behavior of the Dow Jones Industrial is shown below.

Chart courtesy of StockCharts.com
The recent behavior of the Standard & Poor’s 500 is as shown below.

Image courtesy of StockCharts.com
Sometime in February after Trump’s inauguration, both stock indices exploded and, although having reached something of a plateau, even now show a tendency to increase. However, how much of this tendency is based on emotion, and how much on objective reality? Much will depend on whether the Republicans are successful with tax cuts and reforms and with Obamacare “repeal and replace”!
Views: 1,985