


Economic Questions: Is Everyone Fooling Themselves?
Velocity of the M2 money supply (blue curve) and its percent change from a year ago (maroon curve).
Image Credit: St. Louis Federal Reserve District Bank/FRED
In a Fortune.com article this morning, I read some questions about the economy evocative of some other disturbing doubts. Entitled The Fed Is Still Living In Denial, the article by Stephen Gandel wondered whether or not the Federal Reserve is deceiving itself about the health of our economy. Mr. Gandel began by noting the Fed this Wednesday decided to keep interest rates constant for a while longer, and said it would increase rates (if they do at all) a maximum of two more times this year, and four times next year. Since the beginning of the year, the economy in some ways does not look as bad off as it did in the last quarter of 2015. In particular, there have been continuing increases in employment. Gandel noted the Fed’s chairman, Janet Yellen, sounded very upbeat. He wrote,
In her press conference Wednesday afternoon, chair Janet Yellen sounded quite upbeat. “Risks to the downside appear to be diminished,” Yellen said, noting that people were more optimistic about finding work, and that the ranks of the long-term unemployed are falling. “The course of the economy is improving, which likely means that the path of rates is to rise over time,” says Yellen.
Nevertheless, as Gandel observed, the Fed has deceived itself many times before into believing the economy is a lot stronger than it really is. Apparently, Mr. Gandel is like me of a more pessimistic frame of mind about the economy. While Yellin and many others are feeling considerably better about the economic future than at the beginning of the year, Mr. Gandel and I are finding ourselves saying, “Well, yes, but …”
Most of the optimism for near-term economic growth I have heard or read has been because of increasing numbers of jobs. Yet the unemployment rate is a lagging indicator, so it will deteriorate only after the economy declines. The length of the average work week on the other hand is a leading indicator, and is shown in the graph below.

Image Credit: St Louis Federal Reserve District Bank/FRED
Clearly, the average work week has been falling since the beginning of the year.
Another point made by the optimists is the price of oil has fallen greatly over the last year or so, as shown in the plot of the light crude oil spot price in the plot below. Over the last two years the price has fallen from about $100 per barrel to around $40 per barrel.

Graph Courtesy of StockCharts.com
The hope was that all the money people saved in buying gasoline and other oil-based energy would be spent on other goods and services. Unfortunately, higher healthcare costs generated by Obamacare and higher housing expenses seem to be absorbing much of this particular windfall.
Another problematic situation is the inventories to sales ratio, which is increasing rapidly as displayed in the blue curve below. The maroon curve is the percent change of the ratio from a year earlier.

Image Credit: St Louis Federal Reserve District Bank/FRED
Clearly, businesses are not going to be able to produce a lot more if they are simply building up their inventories. With a ratio of 1.4, the average businesses are producing 40% more than is needed to meet demand. As you can see from the red curve, the rate of growth has fallen significantly in recent months but is still at about 3%.
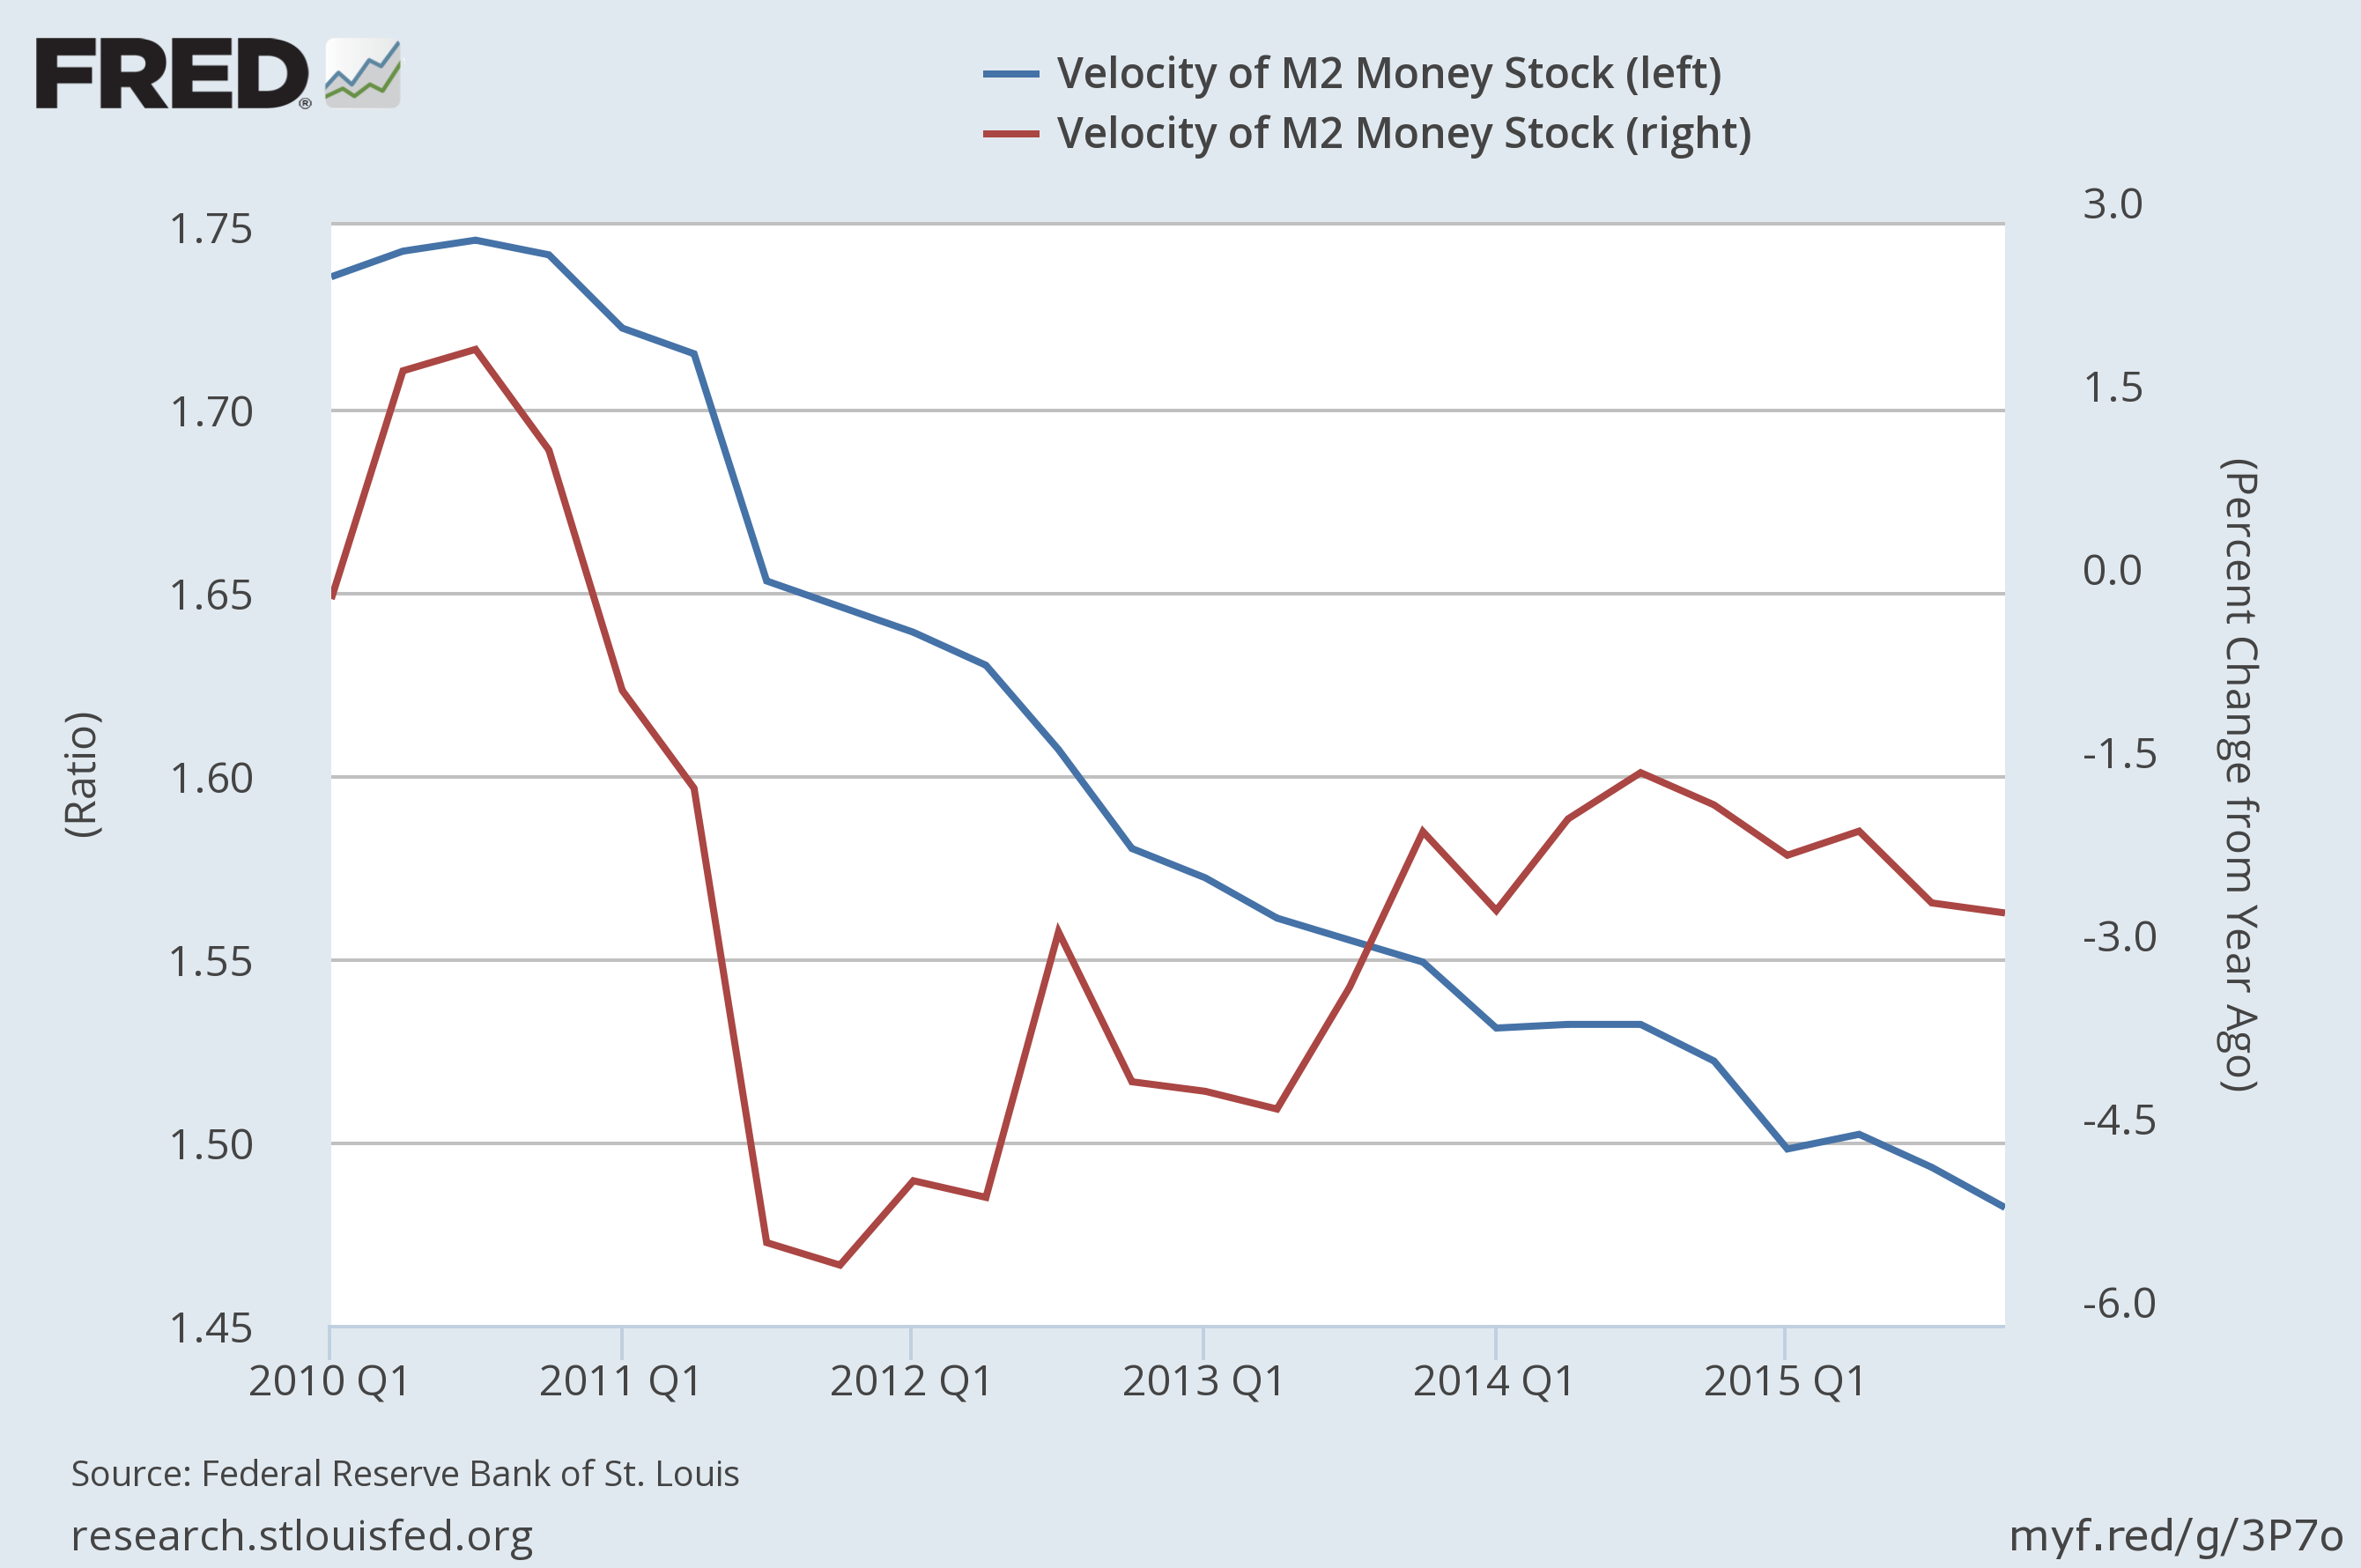
Finally, and most significantly for me, there is the continuing decline in the velocity of M2 money. This is displayed in the featured image at the top of this post, and has been steadily declining since the third quarter of 2010. The rate of decline did decrease from the fourth quarter of 2011 to the third quarter of 2014, when it reached a minimum rate of decline of -1.5%. Since then the rate of decline has increased again to -2.6% currently. The velocity of money is defined to be the average number of times a dollar is exchanged in a year. If the velocity of money is falling and the quantity of money minus the GDP growth is not increasing at a similar rate (which it is not. See the posts Should We Expect Inflation of Delation? and What Does Falling Money Velocity Tell Us?), the only conclusion we can make is that business is declining.
Here are some questions I would ask anyone who is really optimistic about near-term economic growth:
- If the economy is growing in a healthy way, why is the average work week becoming shorter?
- If the cost of gasoline has fallen so much, why can not the average consumer spend more on goods and services?
- If our economy is healthy, then why is the inventories to sales ratio increasing so robustly?
- Finally, and most significantly, why is the velocity of M2 money continuously falling?
These are not the only skeptical questions that can be asked, and a few more are added in the Stephen Gandel article. You claim the U.S. economy is growing in a healthy way? I am not buying it!
Views: 1,804
Just a quick thought: Hours worked have been steadily falling for decades as economies have grown. Most of the countries with the highest standards of living work less than us. 17 out of the top 20 scorers in inequality-adjusted hdi have fewer hours worked than us. We are ranked 27th.
As your observation implies, increases in productivity over the years would allow people to work less for the same standard of living, and this has been the story for many decades. However, over the past one to two decades, I think the story has changed quite a bit. As governments in the developed world have intruded increasingly into our so-called “free-markets”, increases in productivity are not being used as much in increasing standards of living as in eliminating costly human labor. This has especially been true in Europe with their inflexible labor markets, but is becoming increasingly true here. As… Read more »
Thank you for the questions. As I think you know, I’m not a fan of short term economic predictions. There is too much noise to see where the critical pieces of the next decade will land. On investment, it’s a very difficult thing to balance investing and saving. I think that aggregate investment is very important, but I believe that the desired goal of investment which is high growth should be balanced with standard of living improvements. Occasionally I hear about people who spent their lives saving money, and died having lived in squalor with 2 million in the bank.… Read more »
I meant to say it’s difficult to balance investing and spending, rather than saving.
I have finally responded to your comment on possible compromises with the post Compromise Between the Right and the Left.