


Thermodynamic Effects of Atmospheric Carbon Dioxide Revisited
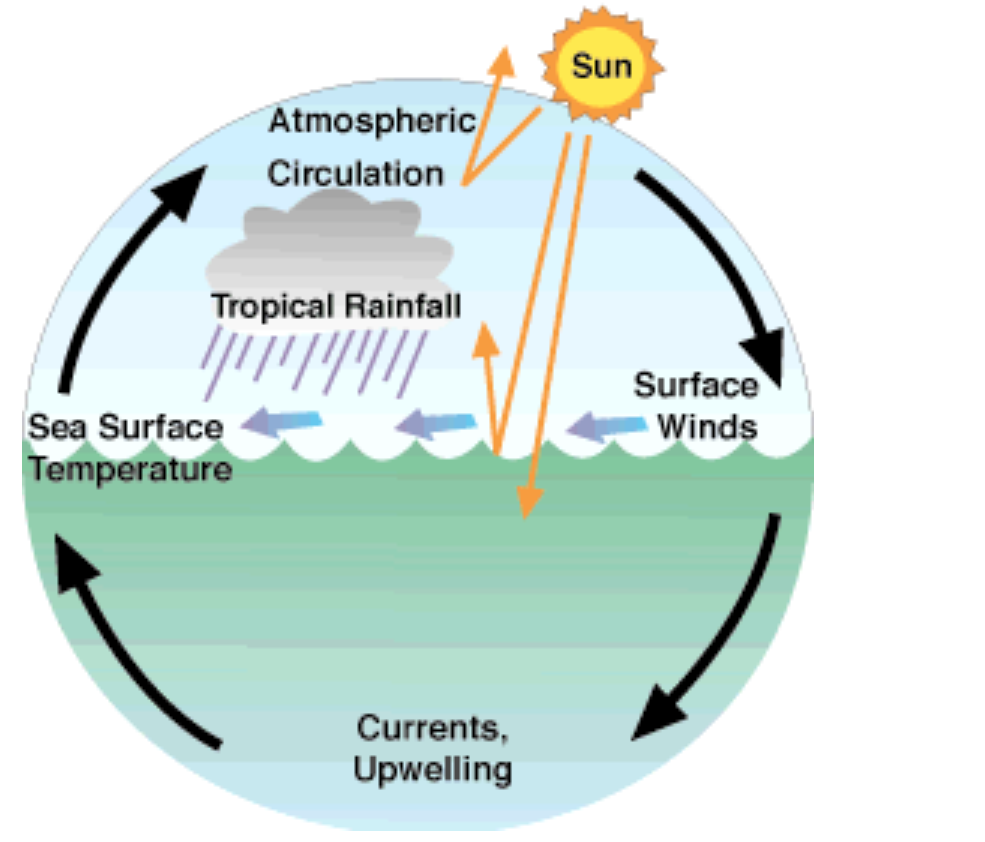
Varieties of interactions between air and sea
Image Credit: NASA Earth Observatory
Apparently, I did not not explain my thoughts clearly enough in my post Thermodynamic Interactions of the Oceans With the Atmosphere, not to at least one reader anyway. What that essay attempted to do was to demonstrate it was energetically impossible for CO2 in the air to heat ocean water enough to evaporate more water into the air. Adherents of man-caused or Anthropogenic Global Warming (AGW) have known all along that there is entirely too little atmospheric carbon dioxide (approximately 0.04% of the atmosphere), and that CO2 molecules could absorb only a minuscule portion of the available thermal spectrum, to do the bulk of the atmospheric heating. Instead, they envisioned carbon dioxide as a trigger to a feedback mechanism that would amplify the CO2‘s effect. The modest amounts of CO2 heating would cause increased heat flux into the oceans, raising their temperatures and creating increased water evaporation. The increased water vapor, being a much stronger greenhouse gas, would then strongly heat the atmosphere. That is their theory, anyway.
What I Had Demonstrated
What I showed in my essay on thermodynamic interactions of air and water is that the amount of thermal energy that can be stored in atmospheric CO2 is insignificant compared to what can be absorbed by the oceans. In fact, an energy transfer from atmospheric CO2 to the oceans’ water sufficient to cause a one degree increase in water temperature would cause a decrease in CO2 temperatures of 2.368×10⁶ degrees Kelvin, a manifest impossibility. Since air temperatures are almost certainly between 200 °K (-99.7 °F) and 325 °K (125.3 °F), CO2 temperatures would have to decrease below absolute zero, which is a physical impossibility. It is just not possible for atmospheric CO2 to hold enough thermal energy to cause a detectable change in ocean water temperature.
Let us change our focus to the atmospheric CO2, and ask if a heat transfer from CO2 to ocean water is enough to cool the CO2 by one degree Kelvin, by how much is the ocean water warmed? The answer is 4.223×10⁻⁷ °K, a truly insignificant amount.
In making these calculations, I assumed whatever thermal energy was given up by the CO2 was absorbed by ocean water. You might justly criticize me for neglecting heat transfer to the land, but any thermal energy from CO2 that goes there would evaporate not nearly as much water as that which goes into the ocean. That particular criticism would not help the AGW case for the water vapor feedback, in fact making the AGW case even worse. Once I made the assumption that whatever was given up by atmospheric CO2 was absorbed by the ocean, it was a trivial matter to calculate how much warming in water was caused for a given amount of cooling of the CO2.
However, one calculation I could not make was to estimate what the actual heat transfer per unit time was. That would have required a much, much more complicated calculation that is probably beyond human capability at the moment. Those who have attempted computer simulations predicting the course of global warming have demonstrated that quite thoroughly. All that can be demonstrated easily is the temperature increase of sea water if a heat transfer from atmospheric CO2 cools it by a given temperature. This bears on my reader’s major objection, which shall be addressed shortly.
Finally, I wrote of two independent yet related physical phenomena, either one of which would saturate the thermal energy carrying capacity of CO2. It seemed obvious to me — but apparently not to others — they also implied CO2 thermal energy could not be continually transferred to the oceans. Let us now take a look at my reader’s major objection of why this is not so.
The Major Objection
The objection was placed on a public Facebook group page called A Divided World Readers, where anyone can make any comments they desire on any of the subjects I write about. Placed as a comment on my post Thermodynamic Interactions of the Oceans With the Atmosphere, the objection was concerned with the time behavior of the sea-air interaction.
The question “is there enough thermal energy in atmospheric CO2 to significantly heat the oceans to increase evaporation?” seems posed in such a way as to be easily used to mislead people, which is what it seems you have chosen to do, because the question contains an implicit clause “…at one given moment”, that renders it relevant to what is actually happening with the climate systems. The system you describe simply does not have any bearing on anything happening in reality. You say that you assumed that “whatever thermal energy was given up by the CO2 was absorbed by ocean water.” That still avoids incorporating time itself into your model. E.g. how many thousands or millions of times heat transfer happens a day, versus how quickly ocean water gets rid of the incoming heat over time. The question as you’ve posed it seems to me to be only good for misleading people, perhaps yourself among them, because it sounds like it adresses an actual natural climate system, but it does not, it is only a time-ignoring model of heat capacities.
That is, even though the heat transfer per unit time is incredibly slow, if it continues constantly for a very long period of time, the heat transfer might amount to something and increase water evaporation. Then the AGW feedback mechanism might still work.
Why the Objection Is Fallacious
On the way to answering why this objection is false, I will first make some remarks on how thermal radiation is distributed among the various wavelengths. I do this to give you a feel for the relative importance of various quantities.
The spectral distribution of thermal radiation is governed by Planck’s law, which gives the radiation’s power density per steradian (sr) of solid angle into which it is emitted per unit frequency or wavelength. It can be stated as a power density in either frequency ν or wavelength λ because their product is equal to the speed of light c. The wavelength version is given by

where Bλ(λ, T)·dλ is the power density in an interval of wavelength dλ centered on the wavelength λ. In this expression T is the absolute temperature of the emission source in degrees Kelvin, h is Planck’s constant, and kB is the Boltzmann constant.
In my last post on this subject I showed a plot of spectral thermal power density distributions (also called a “black body” distribution) at a temperature around the surface temperature of the Sun (about 5,000 °K), as well as for black bodies at 4,000 °K and 3,000 °K, which I post again below.

Wikimedia Commons / Darth Kule
Note that as a black body becomes cooler, its peak falls in amplitude and moves to the right toward longer wavelengths. As a comparison I added a plot of a black body curve at some typical Earth temperature, which I found on the website Global Warming. On it was superimposed the three thermal CO2 absorption lines at 2.7 μm, 4.3 μm, and 15 μm. The plot is reproduced below.

Image Credit: Global Warming
Unfortunately, the temperature of the black body radiation was not given, so I decide to calculate and plot curves for a number of black bodies with temperatures from 280 °K (44.3 °F or 6.85 °C) to 310 °K (98.33 °F or 36.85 °C), just to get a feel for how the thermal radiation varies over typical temperature variations on Earth. The results are displayed below.

There are several important aspects to be noted of these plots. First, compare the units on the vertical axis of this last plot with those on the vertical axis of the plot showing the Sun’s black body radiation in Fig. 1. The units for the plot with the Sun’s black body curve are Kilowatts per steradian per meter-squared per nanometer. Before I continue further, a few words of explanation might be in order for the less technically inclined of my readers. Kilowatts is a unit of power that you are probably familiar with from your monthly electrical bill. One kilowatt is 1,000 watts of power. One watt is the passage of one joule of energy per second. Therefore, if the power is constant and you multiply the power with a period of time, you find the total energy that has passed by. (If the power is not constant, then you have to integrate it over time using integral calculus to get the total energy passed or consumed.) Therefore, the kilowatt-hours you see on your electrical bill is a measure of the amount of energy you have consumed.
A steradian is a unit of something called a solid angle, which might be a little more abstruse. Imagine rays emanating from a single point that all go out a fixed distance R, and imagine you construct a sphere of radius R centered on the emission point. Now. concentrate your attention on a cone of the rays that all go to a small area, dA, of the sphere. The solid angle, dΩ, subtended by that area is then defined as dΩ ≡ dA/R2. If that subtended area is equal to the square of the radius from the center, the solid angle is defined to be exactly one steradian.
Next, we come to the “per meter-squared” part of the units. This is an expression of the fact that the thermal radiation density we have calculated is a density on a real-space surface area of the emitting body, as well as a density in the thermal radiation’s spectrum. A meter is a dimension of length and a meter-squared is a dimension of area. The “per nanometer” piece indicates the calculated power intensity is a density in the wavelength spectrum. Note that one nanometer is one-billionth (10–9) of a meter, which is an indication of the smallness of wavelengths (on the order of one μm, also called a micron, or 10–6 meter), we are considering. To get the total power passing through a given area from a given band of wavelengths, you would have to integrate the Planck’s law power distribution over the area of the emitting object, over the solid angle subtended by the given area, and over the band of wavelengths of interest.
With all of that explanation under our belts, consider the units on the vertical axis of the black body radiation distributions I calculated in the last plot above. The units there are milliwatts per steradian per meter-squared per nanometer. The units are all the same except for those of power: milliwatts (10–3 watts) as opposed to kilowatts (103 watts). “So, big deal!“, you exclaim. What else could we expect with the Sun being so much hotter than anything around the Earth’s surface? Yet without explicitly pointing out how really small heat flow densities are in the oceans and in the air, that is a fact that can easily be missed. These thermal flows, when integrated over wavelength and equivalent areas, are comparable to power emissions from many of your favorite electrical devices (cell phones usually emit anywhere from 0.75 to one watt of power).
Another important aspect comes from comparing the plot of Earth’s black body radiation from the Global Warming website in Fig. 2 against my own calculations in Fig. 3. Whatever temperature was used to calculate the black body curve in Fig. 2 is considerably lower than my lowest temperature of 280 °K (44.3 °F or 6.85 °C), since its peak is at a wavelength of around 30 μm, while the 280 °K peak in Fig. 3 is around 10 μm. As you can see from both Fig. 1 and Fig 3, as a thermal body gets colder, the peak of its thermal radiation intensity falls and moves to the right toward larger wavelengths and smaller frequencies. Also, note the difference in where the thermal CO2 absorption lines are in the two figures. Because of the low temperature used to calculate the black body curve of Fig. 2, all three absorption lines are on the left, higher photon energy side of the curve. The energy of a photon with frequency ν and wavelength λ is given by E=hν=hc/λ, where h is Planck’s constant and c is the speed of light. The absorption line that absorbs the highest energy photons at 2.7 μm is just barely within the black body curve of Fig.2 and almost not at all in the black body curves of Fig. 3. For almost all environments on Earth (probably everywhere outside of volcanoes), the 2.7 micron line is unavailable to absorb thermal photons, reducing the number of active thermal absorption lines to two. Of those two, the 4.3 micron line is just barely within the black body curves and has few available photons to absorb compared to the 15 micron line. Although many more photons are available for absorption at that line, it also absorbs less energetic photons with less than one-third the energy at the 4.3 micron line. That leaves the 15 micron line to do the bulk of the heating of carbon dioxide.
So far I have said nothing to rebut directly the criticism that given sufficient time, even very tiny heat flows might accumulate to significant amounts of thermal energy. I have only re-emphasized in a slightly different way why it is that CO2 can hold such small amounts of thermal energy at its temperature compared to what the the oceans can swallow with almost undetectable increases in temperature. Yet, the amount of heat carbon dioxide can absorb is saturating and increases in CO2 temperature due to increasing CO2 concentrations are becoming increasingly smaller.
In the meantime, any atmospheric CO2 giving off heat to the oceans is losing temperature at a much greater rate than the ocean water is warming. Given the huge difference in total heat capacities of the ocean and CO2 in the air, a more accurate way of putting it is that to the extent there is heat exchange, the CO2 will measurably cool, while the temperature of ocean water will remain for all intents and purposes essentially unchanged. Remember that a heat flow from CO2 to ocean water sufficient to cool the CO2 by one degree Kelvin will warm the ocean water only by 4.223×10⁻⁷ °K. Once the atmospheric CO2 has cooled to the same temperature as that of the ocean, all heat flows will cease. Let us say, just for the sake of argument that the temperature difference between CO2 in the air and the ocean water is 10 °K, a guesstimate I suspect is unrealistically large. In Thermodynamic Interactions of the Oceans With the Atmosphere I showed that if the thermal energy given up by the CO2 were absorbed by the oceans, then the decrease in CO2 temperature, ΔTCO2, is related to the increase in water temperature, ΔTW, by ΔTCO2 = 2.368×10⁶ΔTW. Letting the decrease of carbon dioxide temperature be 10 °K to allow it to equilibrate to water temperature, we can calculate the increase in water temperature as 4.22×10⁻⁶ °K, a temperature increase woefully too small to increase water evaporation for the AGW feedback.
None of this means the oceans are not warming. It just means they are not warming because of CO2 in the air, and certainly not because of CO2 emitted by mankind. The most probable reason the oceans, as well as the rest of the Earth, is warming is that we are in the warming phase of the Dansgaard-Oeschger cycles, which began around 1850 with the end of the Little Ice Age. This warming, interrupted occasionally by warming “pauses”, will probably continue until sometime between the years 2300 and 2400. The total warming during these warming phases is usually limited to around 4°C. For more about this warming, as well as other global warming-related phenomena, see my post The Complexity of Atmospheric Physics.
Other Related Physical Processes
Yet, as I alluded in the last section there are several other physical processes going on which will bring the warming of ocean water by atmospheric carbon dioxide to a screeching halt. The first I will mention is the fact that once a particular molecule absorbs a photon at 15 μm, it makes a transition to an excited higher energy state. After that, it can not absorb any more at that wavelength until the molecule decays back to its ground state by emitting another 15 μm photon. The half-life of the excited state is very long compared to the amount of time it takes for a non-interacting photon to reach the top of the troposphere, where it would most likely be lost to space. Depending on the mode of decay (collisions with other molecules or spontaneous emission), the half-life can be anywhere from 1 μsec to about half a second. Taking the thickness of the troposphere to be 20 km (its thickest extent at the equator), the shortest photon flight time to the top of the troposphere is around 6.67×10⁻⁵ seconds. As long as the CO2 molecule is excited, it can not delay any other photons at the same wavelength as caused its excited state; they will all stream past the excited molecule without hinderance. Because the photon’s travel time between molecules is incredibly short compared to the lifetime of the excited state, we can be assured that a very high fraction of all the carbon dioxide molecules will be saturated. This means that most of the time thermal photons that can be absorbed by CO2 will just fly by the saturated molecules on their way to space. Other molecules in the atmosphere, such as water, nitrogen, and oxygen, can not absorb those particular photons because they do not have absorption lines at those wavelengths. In this way, saturated CO2 molecules open up a channel for some infrared photons to be lost to space, thereby cooling the planet. Admittedly, it is a very small channel, but it is there.
A second thing that happens is that as unsaturated CO2 gobbles up photons at the wavelengths it can, it depletes the population of available photons flying by. This depletion is made even more severe as more CO2 is added to the atmosphere from whatever source, whether from the oceans or by mankind. As a result, each additional increment of newly added CO2 will heat the atmosphere less and less, as shown in the plot below.

Image Credit: JoNova.com
Conclusions
So what can we conclude? The first and most important verdict is that atmospheric CO2 will transfer heat to the ocean only until their temperatures become the same. At that point all heat transfer will cease. Because the total heat capacity of the oceans is enormously larger than that of atmospheric CO2, this process will proceed primarily with CO2 cooling and the water temperature remaining essentially constant. In no way can atmospheric CO2 heat the oceans enough to increase ocean evaporation and thereby atmospheric water vapor concentrations. These observations answer my reader’s objections, as well as demolishing basic AGW theory.
Secondly, atmospheric CO2 is losing its ability to warm the atmosphere. This is because most such molecules are becoming saturated for the vast majority of the time with those photons they are capable of absorbing. Additionally, adding more CO2 does not appreciably increase the amount of thermal energy it can absorb. This is because the population of photons at wavelengths CO2 can absorb have already been mostly absorbed.
The theory of anthropogenic global warming lies before us in ruins. It is impossible for me to see how anyone can take it seriously.
Views: 3,943