


Global Cooling May Intensify – Cosmic Rays Increasing
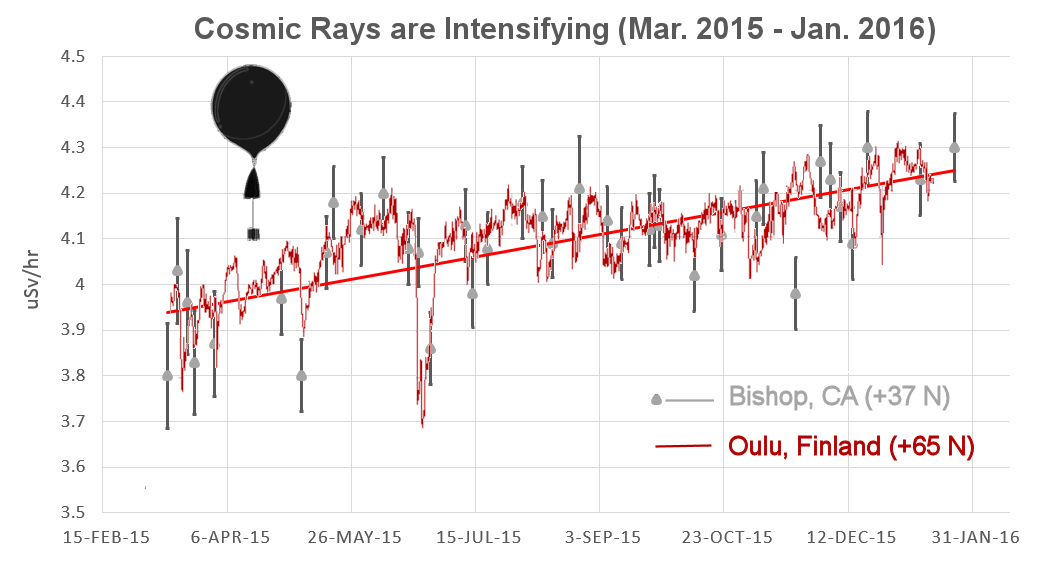
Cosmic ray intensity between March 2015 and January 2016.
Image Credit: Spaceweather.com
As shown in the plot above, cosmic ray intensity has intensified between March 2015 and January 2016. In this plot, values of cosmic ray intensity derived from neutron monitor measurements at the University of Oulu, Finland are shown in red, while cosmic ray intensity measurements derived from gamma-ray/X-ray measurements over Bishop, California are shown in gray. The measurements over Bishop were made by helium balloons launched by a group of high school students called Earth to Sky Calculus in collaboration with Spaceweather.com. Cosmic ray intensity is plotted in units of microsieverts per hour (uSv/hr), where a microsievert is one millionth of a Sievert, and a Sievert is a derived unit of ionizing radiation dose.
If the model of global warming I have written about in the posts Clouds and Global Warming and Solar Power Output and Global Warming is correct, intensifying cosmic rays would herald global cooling, or at least a continuing pause of the global warming we have seen since about 1999. We have evidence that solar power output has been decreasing, which should cause cosmic rays reaching Earth to increase in intensity. This is verified by the plot above. Since cosmic rays are mostly composed of charged particles, they interact strongly with the solar wind; a more intense solar wind should blow more of the cosmic rays away from the inner solar system. A decreasing solar wind from a Sun that is becoming less active, on the other hand, will allow more cosmic rays to penetrate deep into our atmosphere. There the charged particles colliding with particulates suspended in the atmosphere will cause more particulates to ionize to make them nucleation centers for cloud formation. More clouds then act as shields mirroring incident solar radiation, particularly infrared radiation, back into space. This causes atmospheric temperature to be less than what it might otherwise be.
The plot shown above gives us even more reason to believe the periods of global warming we have seen have absolutely nothing to do with human CO2 emissions. Read the post Global Warming: A Summation for a more complete picture of our model.
Views: 2,926