


U.S. Stock Markets and the Economy, April 2016
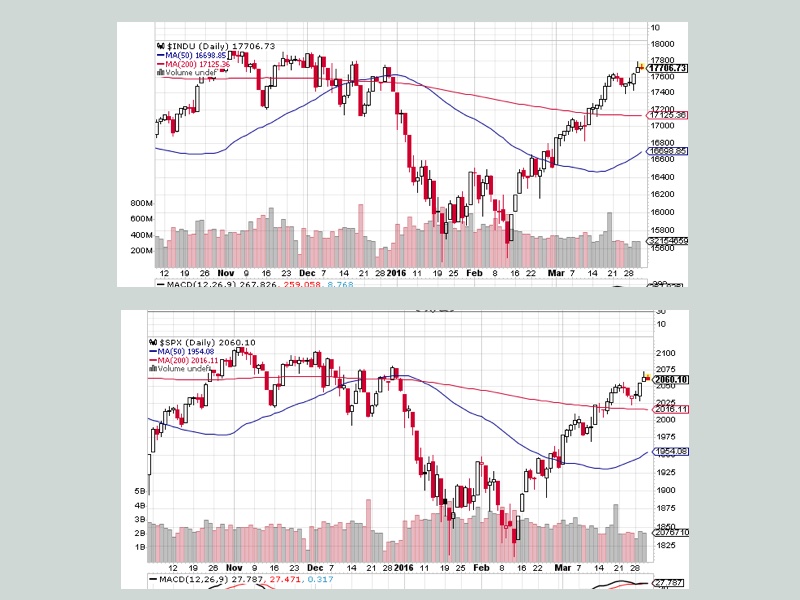
Candle charts of Dow 30 index on top, S&P 500 on bottom. Blue overlay curves are 50 day moving averages, Red curves are 100 day moving averages.
Images courtesy of StockCharts.com
Confirmation that “Bad is Good” Meme Is Back!
From the charts for the Dow 30 and the S&P 500 shown above, you can see confirmation the “Bad is Good” stock market meme has been restarted. Despite the fact corporate earnings have been in recession for almost an entire year, the major stock market indices have recovered most of their losses since the beginning of the year. The betting now is that average S&P 500 earnings per share (EPS) in the first quarter of 2016 will have fallen about 4% year-over-year from the EPS in the first quarter of 2015. If that turns out to be true – and we should find out in April – then corporate earnings will have been in recession for an entire year.
Stock prices of a company should reflect the company’s profits. After all, the fundamental reason for buying a company’s stock is to get a share of its profits. The Federal Reserve has unhappily severed this relationship in two ways. First, by keeping both short-term and long-term interest rates effectively at zero for such a long time (ignoring the 0.25% increase in the Fed Funds rate window last December), the Fed has destroyed incentives to invest in any asset class that depends on interest rates for profits. Why buy government bonds when the real interest rate after inflation is zero? About the only asset class left for possibly profitable investment is stocks. Secondly, if investors can borrow money at effectively zero interest rates, they can use that borrowed money to buy stock. As the inflated stock market rises, the investors can then sell some of their stock to pay off the loans. Of course this is a very dangerous path to take, because the investor had better pay off those loans before people discover stock price increases have absolutely nothing to do with increasing corporate earnings, nor with the prospect of a healthily growing economy!
There is one other very important mechanism supporting the “bad is good” meme, and according to Lu Wang, in the post There’s Only One Buyer Keeping S&P 500’s Bull Market Alive on the Bloomberg website, it is the dominate reason for stock markets continuing to rise. He makes the persuasive postulate that corporations buying back their own stock are the major impetus for the markets’ recent rise. Wang’s major piece of evidence is the plot below, showing corporate buy backs as a function of time.

Image Credit: Bloomberg.com
The superimposed bar chart shows the quarterly investment fund flows, the other big institutional investors in the markets. Notice for the earliest years on the chart, 1998 to about 2004, corporate buybacks were steady and institutional fund equity buys were generally larger or of the same size as the buybacks. The one exception is the period of economically parlous times introduced by the recession of 2001 and punctuated by the terrorist attacks on September 11, 2001. Beginning in 2004 corporate buybacks increased in size and began to dwarf institutional fund flows. I suspect this was because companies were beginning to experience increasing government roadblocks to economic activity and found it easier and more profitable to buy back their own stocks to increase their earnings per share. This continued until the financial crisis of 2007-2008 and the Great Recession that followed. After the recovery corporate buybacks continued their climb, dwarfing any positive fund flows. The funds have in fact been selling stock more often than buying since the recovery. Corporations appear to be the dominant players currently.
Just like institutional investors, corporations are also borrowing large amounts of cheap money (just like the Fed wants!), but instead of investing that money in new productive capacity, they are spending it to buy back their own stock (not at all what the Fed wants!). A Reuters special report, The Cannibalized Company, reveals
A Reuters analysis shows that many companies are barreling down the same road, spending on share repurchases at a far faster pace than they are investing in long-term growth through research and development and other forms of capital spending.
Almost 60 percent of the 3,297 publicly traded non-financial U.S. companies Reuters examined have bought back their shares since 2010. In fiscal 2014, spending on buybacks and dividends surpassed the companies’ combined net income for the first time outside of a recessionary period, and continued to climb for the 613 companies that have already reported for fiscal 2015.
Since increases in stock valuations currently have little to nothing to do with economic growth or the economic value of companies, all that is required for the stock market to advance is the continued supply of cheap money by the Federal Reserve. It is a fantasy investment world unsupported by economic reality, and it could collapse in an instant. As soon as the Fed decides to increase interest rates in earnest, stock prices will crumble. Because a lot of investors, as well as the Fed, understand this, the most important factor to which they must stay attuned is the Fed’s willingness to keep money cheap to borrow. For this reason, CNN Money’s Heather Long believes there is a nearly 60% probability – based on a CME Group FedWatch tool – that there will be no further rates hikes this year. If the Fed betrays the markets and starts to hike interest rates, the market collapse could be swift. In the view of many investors, bad economic news that ensures the Fed will continue cheap money is good for the stock market.
U.S. Economy Is Faltering
In the meantime, the Atlanta Federal Reserve District has just given us a stunning shock with an update of their first quarter 2016 estimate of GDP growth. Called “GDPNow”, the statistic is a running estimate of how much the next quarter’s GDP growth would be. As of April 1, 2016, the latest GDP forecast for the first quarter GDP is 0.7%, which is up slightly from the 0.6% forecast on March 28, yet considerably less than the current Blue Chip Economic Indicators consensus of roughly 1.9%. If 0.7% ends up being the actual first quarter growth rate, it would not take much of a shock to push it into negative territory
In addition, I have just updated my leading economic indicators, which are giving off a -4 bearish signal (over a range between -12 and +12). Of these indicators, the ones I find most compelling are M2 money velocity, the total business inventories to sales ratio, the producer price index for copper and copper products, and the federal debt as a fraction of GDP. A plot of the M2 money velocity is shown below.

Image Credit: St. Louis Federal Reserve/FRED
The money velocity is the number of times the average dollar changes hands per year, and as you can see from the graph above, it has been continually decreasing for a number of years now. Also, the maroon curve giving the percent change from a year ago tells us the percent change has not been more than -1.5% per year and is currently about -2.6% per year. You might immediately object this does not tell us much as the effects depend on how much the M2 money stock has increased. If the total quantity of money increases enough, even a very small money velocity can enable a large amount of trade. Yet, as I showed in Should We expect Inflation or Deflation and in What Does Falling Money Velocity Tell Us? , the increase in the quantity of M2 money, taken together with the decrease in money velocity and a modest increase in GDP was enough to give us an almost nonexistent inflation rate of 0.7% inflation rate. Given measurement errors for these quantities, the inflation rate could easily be slightly negative, i.e. deflationary. With at best modest economic growth, falling money velocity can only mean that households, companies, and governments are together spending money more slowly, which is a sign of a faltering economy.
Next in importance is the recent behavior of the inventories to sales ratio. If companies are producing their products faster than the products are sold, then the inventories to sales ratio will rise and the producers will have to cut back on production, either laying off employees, decreasing their work hours, or decreasing their pay. Any of these responses would decrease GDP growth. And indeed, as you can see in the plot below, the inventories to sales ratio has been increasing quite rapidly recently.

Image Credit: St. Louis Federal Reserve District Bank/FRED
The most recent reading of the ratio in January was 1.56, while its percent change in a year was 6.12%. The only response possible is for over-producing companies to cut back on production until a large fraction of the inventories clear.
Because of its importance in producing electrical equipment and wiring, the price of copper is an almost infallible predictor of future economic activity. You can see its activity in the plot below of a producer price index for copper and copper products that was normalized to 100 in 1982.

Image Credit: St. Louis Federal Reserve District Bank/FRED
The copper index has been predominantly falling since February 2013 and its percent change has also been predominantly negative. How can the economy be vigorously expanding when a commodity critical to electrical wiring and equipment is not selling?
Finally, and far from least is the national debt as a fraction of GDP, which is shown below.

Image Credit: St. Louis Federal Reserve District Bank/FRED
Last August I celebrated the fact that sequestration had temporarily halted increases in federal spending, and that that situation would continue until about 2021, when sequestration was supposed to cease. Well, that turned out to be a very temporary reprieve. Recently the national debt/GDP ratio and its rate of increase have markedly increased, and the Congressional Budget Office has just informed us in their annual budget and economic outlook report that the budget deficit will again begin to rise this year – approximately 5 years early – after six years of decline. Currently the national debt is 104% of GDP. We know from the researches of Carmen Reinhart and Kenneth Rogoff that anytime sovereign debt exceeds about roughly 80% to 90% of GDP, government borrowing to finance deficit spending begins to crowd companies out of financial markets and begins to kill private investment. This indicator has changed to very, very bearish.
What Will Government Do?
In the short-term, the only branch of government that has any freedom of action to change matters is the fourth branch, the Federal Reserve System. The political branches, the executive branch and Congress, are too grid-locked by their ideologies to progress beyond their dysfunctions. Please understand that I do not blame the progressives of the Democratic Party any more than I blame the conservatives of the Republican Party for this fine mess of affairs. Each of these groups have sincere beliefs and profound feelings that the policies of the other side would be fundamentally destructive to the Republic. There is probably almost nothing they could agree upon beyond whether or not the weather of the day were pleasant. The part of society that bears the most blame for government dysfunction is the electorate. Dysfunction will not disappear in the political branches until the electorate decides which side has the better understanding of the nature of Reality, and puts that side in power in both the executive and the Congress.
On the other hand, in the fourth branch the New Keynesians are totally in control. Unfortunately, they have a very bad reputation for accuracy of either economic prognosis or prescription. The major central banks of countries all over the world (also mainly controlled by New Keynesians, sad to say) have come very close to killing their patients. As criticisms of their dreadful policies, consider the posts Quantitative Easing and Its Effects, Why Have ZIRP and QE Failed?, Economic Damage Created by the Fed, The Insanity of Negative Interest Rates, BOJ Also Losing Credibility and Its QE War, and The Bad Examples of the ECB and BOJ.
About all the Federal Reserve has left in its Keynesian toolkit are low interest rates, both short- and long-term, to endeavor to move companies to borrow and spend on new productive capacity. When someone points out to them they “are pushing on a limp string” since companies currently see very little profit in investing in the United States, they might just shrug their shoulders and say, “we can only do what is in our power! The political branches must do their part with fiscal policies to stimulate the economy.” And they would be at least partially correct. The political branches should stimulate the economy by drastically cutting federal spending, severely pruning economic regulations (see here and here and here, and here), and cutting and reforming taxes, particularly corporate taxes. As for what the Fed should do, they should not be attempting to stimulate the economy. They are the wrong tool for the job. Instead, they should be doing all in their power merely to maintain the buying power of the dollar.
Views: 2,269