


The Solow-Swan Model and Where We Are Economically (3)
In this post we will permit more dynamic economic change in the Solow-Swan model than we did in the previous two posts. This is accomplished by allowing the curves describing the three major model variables to vary in shape.
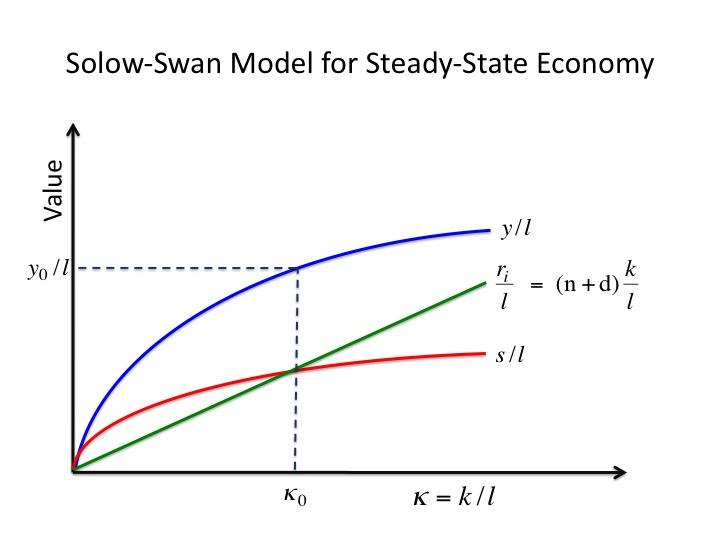
An economy in the Solow-Swan model is defined by three variables as functions of the capital to labor ratio. These are GDP per capita, y/l; replacement investment, ri; and savings per capita, s/l. If these curves never change their shape, the model is totally defined in the simultaneous plotting of these three functions of κ = k/l, where k is the total value of capital stock (any physical asset used in creating goods and services) in the economy, and l is the total number of workers. If we assume everyone is employed, l is also the number of the population. This is not a necessary assumption, but it does make calculations somewhat simpler. A Solow-Swan diagram for any economy looks something like the post theme image shown above.
As we discovered in our last post, if the three major curves of the model remain unchanged, the economy will relentlessly move toward the equilibrium point where the replacement investments entirely absorb all available savings, leaving absolutely nothing to invest for growth. Then, all macroeconomic change per capita ceases. So what would changing each of the curves do, and how could we engineer the changes? First, let us think about what happens if somehow we could increase savings by increasing the savings rate θ. The savings per capita is given by
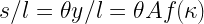
Here we have used the same Cobb-Douglas production function for the per capita GDP we used in the last two posts. We will postulate no change in either the total factor productivity A or the structure of the function f(κ), but change only in the savings rate. If somehow the savings rate θ is increased, we could get a change as illustrated below.

The effect of changing the savings rate is restricted to the savings per capita curve; the other two curves remain the same. The old s/l curve before the change is now the dashed red curve, with the new s/l curve the solid red curve. Increasing the savings rate does indeed increase growth and GDP by intersecting the replacement investment line at a higher value of κ = κ1. Of course, if the government does something really stupid to reduce the savings rate, we could end up with the dotted brown curve with a new steady state point at a greatly reduced κ = κ-1 and a correspondingly lower GDP! We will return to this point a little later.
What else can we do to change the rules of the game? What, for example, can we do to the replacement investment line? Clearly, if we could reduce the slope of the line, given by n + d, the line would intersect the savings curve at a higher value of κ as demonstrated in the figure below.

To reduce the replacement investment at any κ, one would have to reduce the depreciation rate by making physical capital stock more rugged and long-lasting, or by reducing the population growth rate, or both.
Finally how could we increase the GDP per capita, y/l = A f(κ)? Remember, we have postulated we have already done all we could by increasing κ, with all of the dependence on capital and labor localized in the function f(κ), so the only thing left to change is the total factor productivity A. The effect of changing A to some larger value A’ is shown below.

Since the GDP per capita is increased, the savings rate will also increase since savings is directly proportional to GDP. The increase in A then pushes up the savings curve, causing it to intersect the replacement investment line at a higher value of κ = κ1 and giving the economy a new steady state point. Within the total factor productivity is the dependence of GDP on all secondary factors of production, i.e. anything that affects production other than the primary factors of capital and labor. Therefore, some ways to increase GDP growth in this fashion are to increase labor productivity by using higher levels of technology and to increase the skill level of a more highly educated work force.
There seems to be a general agreement among macroeconomists that the most useful way to shift these three curves in a useful way is to concentrate on the development of technology for productivity enhancements and to develop a more highly skilled work force that can easily use this new technology. As far as anyone can see, the economy can grow pretty much ad infinitum by increasing A.
Changing the other two curves seems to have definite limits. For example, to lower the slope of the replacement investment line requires decreasing the depreciation rate, the population increase rate, or both. It is conceivable the population increase rate could be reduced to zero with a steady-state population, but reduction of the depreciation rate depends on things like advances in material sciences. Eventually, the properties of matter should put a limit on how rugged and long-lasting we can make equipment. Also the depreciation rate includes the loss of some old equipment due to obsolescence. Unless advances in technology come to an absolute halt, we will always have some of that. As for increasing total savings by increasing the savings rate, that rate can never even approach one. People have to eat after all!
So how well do the economic policies of the United States encourage economic growth by shifting one or more of these curves? Overall, the answer is not very encouraging. Perhaps the single most egregious attack of the government on the U.S. economy is the destruction of national savings by the Federal Reserve and the executive and legislative branches of the federal government as we noted in The Importance of Personal and National Savings. The total concentration of the Keynesians on the Federal Open Market Committee (FOMC) for the last six years has been to keep both short-term and long-term real interest rates as close to zero as possible. Why should anyone, either in a household or a company, save anything if the real interest rates are all zero? The incentives are not only to spend but to borrow and spend at the same time. Savings is abandoned.
As for the executive and legislative branches of the government, they have had a negative savings rate for almost as long as living memory, with expenditures far outnumbering revenues. All that has saved us from crashing due to the lack of replacement investment even to cover depreciation, is the intervention of foreigners, especially the Chinese and Japanese, to plug the hole of the government’s negative savings by buying U.S. Treasury Bonds. They may not be so generous in the future due to their own economic problems motivating them to sell their holdings of U.S. treasuries to support their own currencies. See here and here. This increases the supply of treasuries on the market, which decreases their price and increases their yields, thereby increasing long-term U.S. interest rates. The point of interest here is not the loss of Fed control over long-term interest rates (which has its own problems, especially for the federal government needing to service its humongous national debt), but the loss of incentives for foreigners to help plug our big national savings hole. Will we be able to muster enough national savings even to cover replacement investments? I have my doubts. If we can not meet replacement needs, we can expect the economy to quickly contract.
How about the effects of government policies on total factor productivity? Every regulation and tax that discourages corporations from investing in new technology or that causes corporations to become less efficient due to government-mandated expenditures and paper work causes total factor productivity to decrease. Consider this post from TheHill.com and our posts The Burden of Government Regulations and The EPA, CO2, Mercury Emissions, and “Green” Energy, The Debilitating Effects of Obamacare, and Economic Effects of the Dodd-Frank Act for confirmation that total factor productivity is suffering under the Obama administration. I know of no action by this administration that has actually increased total factor productivity.
Views: 5,245