


Obama Has Not Produced An Economic Recovery
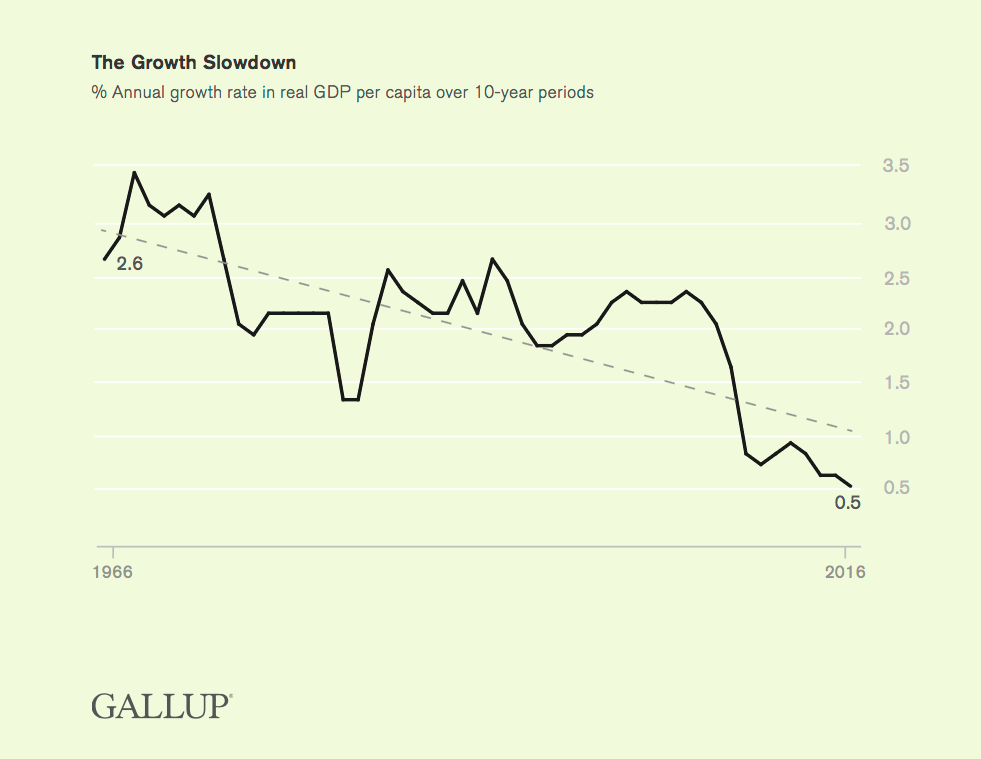
Plot of annual Real U.S. GDP per capita growth in percent averaged over ten year periods
The Gallup Organization
Despite all the parroting by much of the media, Obama has not created an economic recovery. Also, it must be admitted, he has not been the primary cause of all our economic troubles either, as the graph above makes clear. However, as the plot also shows, Obama has definitely added to the problems,
A Discouraging Report
The graph was taken from the cover page of a Gallup Organization report on a long-term decline in U.S. productivity. It was entitled No Recovery: An Analysis of Long-Term U.S. Productivity Decline and was written by Jonathon Rothwell, Gallup Senior Economist. You might well question why you see no periods of negative GDP growth, i.e. recessions in the plot. Because the points on the graph are averages over ten-year periods, the recessions have been averaged out to show only a long-term trend. As you can see, that trend definitely and very disturbingly is negative. If that trend is not interrupted, the long-term GDP growth rate will become permanently negative within a few decades (perhaps within even one!), casting us into ever-lasting depression. Shockingly, from 2007 to 2015 the decade-averaged annual GDP growth was less than one percent and is declining.
From the report’s executive summary, we read,
For decades, the nation’s income, measured as GDP, has barely grown overall; on a per capita basis, median household income peaked in 1999; the subjective general health status of Americans has declined, even adjusting for the aging population; disability rates are higher; learning has stagnated; fewer new businesses are being launched; more workers are involuntarily stuck in part-time jobs or out of the labor force entirely; and the income ranks of grown children are no less tied to the income ranks of their parents.
Why the deterioration? The report dismisses suggestions that it is due to less entrepreneurial innovation or to worker displacement by technology. Instead, more encouragingly, it claims
… that deterioration in large, vital sectors of the economy is far from inevitable, but rather an entirely reversible outcome that can be linked to specific policies, rules and regulations that have arisen and accumulated after decades of weak political leadership — often at the state and local levels — and lobbying by interest groups.
In particular, the report emphasizes decreasing productivity in several industries caused by government imposed inefficiencies; housing, healthcare, and education sectors stand out as drags on economic growth. Whenever government regulations increase costs of production, the dollar value to the producer of whatever is produced per unit hour of labor, i.e. the productivity of labor, must necessarily fall. Whenever productivity falls for a particular good, the cost to purchase that good will also increase as the producer attempts to recover the extra costs, which can be viewed as an inflation of its price.
The Competitive Enterprise Institute has estimated the 2016 cost of federal government regulations to be $1.885 trillion, or 10.1 percent of this year’s estimated $18.658 trillion GDP. That is a very hefty price tag for me to have the privilege of the EPA regulating water puddles in my yard as navigable waterways! The regulation costs are shown below broken down by regulation type. Note that in the figure the notation ‘DHS’ refers to the Department of Health and Human Services, ‘DOL’ labels the Department of Labor, and ‘DOT’ is the Department of Transportation.

Competitive Enterprise Institute
These regulatory costs have mounted year after year, decade after decade, in Democratic and Republican administrations alike, at least since Franklin Delano Roosevelt’s administrations in the 1930s. As a result of spiraling price increases caused by increasing regulations, the Gallup Organization report tells us that the three sectors of healthcare, housing, and education cost us 36 percent of total GDP in 2015, up from 25 percent in 1980. It is no wonder then that the growth rate of real per capita GDP has been crashing over the 50 years between 1966 and 2016.
Moreover, the intergenerational progress in educational quality in the United States appears to have already stagnated. On literacy and math, Americans born around 1975 (aged 35 to 39 in 2012) score signifcantly higher than previous generations going back to people born around 1950. Yet, there are no signifcant differences between those born around 1975 and later generations on math and literacy. … adjusting for the racial composition of test takers and whether they were born in the United States makes no difference to the results. For math and literacy scores, the effect is exactly the same after adjusting for race and birth country. Scores rise across age-group cohorts by about one-third of a standard deviation between 1950 and 1975 for those born in the United States, but peak at that point with no signifcant differences thereafter.
These results implicate the entire education system in America, and they look no better for those who manage to acquire a bachelor’s degree or higher. In fact, cognitive scores for both literacy and math peaked even earlier among bachelor’s degree holders. Those born around 1970 score higher than previous cohorts, but no later cohort has achieved significantly higher test scores.
These results provide prima-facie evidence that the quality of higher education in America peaked in the late 1980s and early 1990s and has not improved since.
The malfeasance of the American education sector has extremely distressing implications for the American economy, since the education sector cannot supply the skilled labor force the economy requires. The report concludes,
To summarize, the quality-to-cost ratio has fallen for education, leading to reductions in GDP per capita growth. Education quality appears to be roughly the same in 2014 as in 1980 and is certainly no better, despite massive
cost increases.
The deeper you dig into the Gallup Organization’s report,the more you realize government is not the answer to any economic problem. In the immortal words of President Ronald Reagan, government is the problem.
Trump to Combat Secular Stagnation?
If you can believe the results of the Gallup Organization’s reports, anything we can do to decouple American governments — federal, state, and local — from the American economy the better off we will be. Anything government can do to increase the capacity of companies to produce wealth and new jobs, and to get itself out of the business of regulating companies, will better position our economy to fight off secular stagnation.
Look again at the decadal average of GDP growth at the top of this post. It should be clear from that plot that the slow-down in GDP growth has been multigenerational, slowing under most Democratic and Republican administrations alike. There are some exceptions, e.g. the Reagan and Clinton administrations, but during most other administrations the changes in long-term growth rates have been distinctly down-hill. Why is that? What has been constant about what affected the economy through-out the time between 1966 and 2016?
What has been constant, not only in the United States, but in Europe as well, has been the paradigm adopted by academic, economic, political, and media elites for ruling society. It was the burden of the elites, their noblesse oblige, to manage the economy for the sake of the common people. They assumed they were actually capable (the more fools they) to actually control something as complicated as a modern economy. The current revolts of the common people, both in Europe and the United States, as seen in the Brexit vote, in the recent Italian constitutional referendum, and in Donald Trump’s presidential election, seem to herald a change to a new paradigm for ruling.
What happens now is very much up in the air. We can reverse course to a more free-market organization of the economy, or we can decide to embrace an even more authoritarian government control of the economy. In the immediate U.S. future, President Donald Trump seems to promise a swerve toward free-markets, with a large scale reduction of economic regulations (particularly with the repeal and replace of Obamacare, repeal of most of the Dodd-Frank Act, and the repeal of many anti-carbon EPA regulations), and with a huge reduction in taxes, particularly for corporations. Whether or not the anti-dirigiste revolution continues after Trump depends on the results of those reforms, and whether or not neoliberals (more usually known as conservatives) such as myself can persuade the progressives of the errors of their ways.
Views: 1,731