


In Which States Does $100 Buy The Most?
Last week on July 8 The Tax Foundation published a report entitled The Real Value of $100 in Each State. In their study they took data from The U.S. Bureau of Economic Analysis (BEA) on the price levels of various states.Then BEA computed a price index for a basket of goods for each state and the District of Columbia. [See here for the technicalities of computing a price index. In this case price indices for the same basket of goods were computed for different states rather than for different times.]
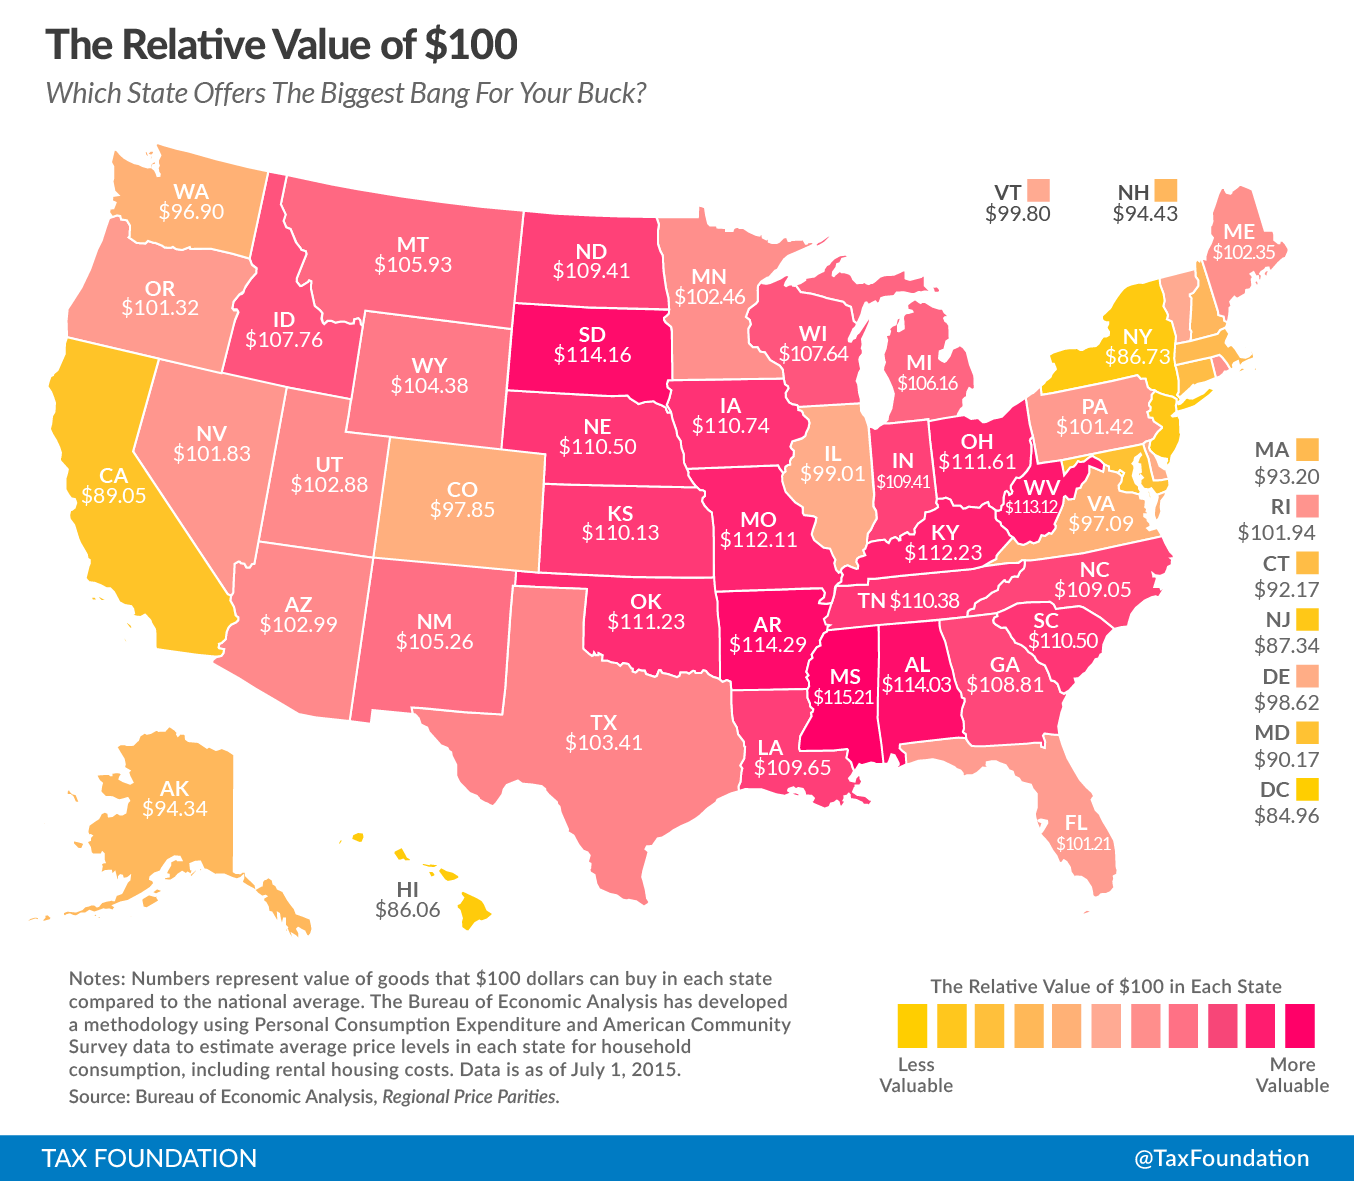
This was done for the year 2013, so the data set is a little dated, but is revealing nevertheless of states in which people are better off with the same amount of money. The average of the price indices was computed and scaled to 100, and the state indices were scaled using this same scale factor. If we say that 100 standard dollars are used to buy goods in this mythical “average” state with a price index of 100, we can use the scaled price indices of the various states to compute the buying power of 100 standard dollars in the states. The result is the U.S. map shown above, color coded for buying power. This map was produced by The Tax Foundation and is part of their report. The states colored red have the greatest buying power (smallest cost-of-living), with bright yellow having the least (highest cost-of-living). The 10 states (including the District of Columbia) with the worst buying power are shown below with the value of 100 state dollars in terms of standard dollars. Number 1 has the worst buying power.
- District of Columbia $84.96
- Hawaii $86.06
- New York $86.73
- New Jersey $87.34
- California $89.05
- Maryland $90.17
- Connecticut $92.17
- Massachusetts $93.20
- Alaska $94.34
- Washington $96.90
If we now go through the same exercise for the 10 states with the best buying power with number 1 being the best, we will generate the following list.
- Mississippi $115.21
- Arkansas $114.29
- South Dakota $114.16
- Alabama $114.03
- West Virginia $113.12
- Kentucky $112.23
- Ohio $111.61
- Oklahoma $111.23
- South Carolina $110.50
- Tennessee $110.38
These are very large differences in buying power. The per cent difference between Mississippi, with the greatest buying power, and the District of Columbia, with the worst, is 35.6%. Another thought that seizes us in looking at the map and the two lists is that the worst states are almost all states that have been dominated by the Democratic party for a long time, while the best states are ones that have been substantially controlled by either Republicans or by that rarest of political species, the conservative Democrat. (I would hardly call the Senator and one time Governor of West Virginia, Joe Manchin, a progressive.)
Pondering these statistics, Mark J. Perry, a scholar at the American Enterprise Institute (AEI) and a Professor of Economics and Finance at the University of Michigan, wondered what the results would be if he took the per-capita personal income of each state and adjusted it for state price-levels and taxes. I will not reproduce his results as the table is rather extensive, but you can see it in Perry’s AEI article here. As a talented work force can not be attracted to a high cost-of-living state without offering a compinsatingly large income, it should be no surprise that the list of states in order of their personal per-capita income is the inverse of the list of states by cost-of-living. The District of Columbia has the highest per-capita income and Mississippi has the lowest. Abstracting from Perry’s Data, I will list the 20 states with the highest and lowest cost-of-living above according to their per-capita personal income. The rank number associated with a state is its ranking in per-capita income among all 51 of the states and the District of Columbia. Side by side with it is the ordering of these same states according to per-capita income adjusted for price-levels and taxes. The final column for each state’s entry gives the change in the state’s rank due to the adjustment of personal income by price level and taxes. Rank 1 in both lists is the District of Columbia with the highest per-capita personal income. The data comes from Perry’s AEI article.
| State | Rank | Adjusted Rank | Shift in Rank |
|---|---|---|---|
| DC | 1 | 1 | 0 |
| Connecticut | 2 | 5 | -3 |
| Massachusetts | 3 | 7 | -4 |
| New Jersey | 4 | 16 | -12 |
| New York | 5 | 29 | -24 |
| Maryland | 6 | 13 | -7 |
| Alaska | 10 | 11 | -1 |
| California | 12 | 37 | -25 |
| Washington | 13 | 17 | -4 |
| South Dakota | 20 | 4 | +16 |
| Hawaii | 22 | 48 | -26 |
| Oklahoma | 28 | 15 | +13 |
| Ohio | 31 | 25 | +6 |
| Tennessee | 35 | 27 | +8 |
| Arkansas | 43 | 31 | +12 |
| Alabama | 45 | 33 | +12 |
| Kentucky | 46 | 41 | +5 |
| South Carolina | 49 | 45 | +4 |
| West Virginia | 50 | 42 | +8 |
| Mississippi | 51 | 44 | +7 |
As expected, the highest ranking states, which tend to be the highest taxing states with the highest costs-of-living, are reduced in rank by the tax and cost-of-living adjustments, some of them reduced greatly. New York, California, and Hawaii are reduced in rank by more than 20! Also as expected, the states at the bottom of the per-capita personal income rankings are all shifted upwards in rank by the adjustments, some by more than 10 ranks. These results certainly should change some views on which states are wealthy and which are not. California (adjusted rank 37) for example goes from being in the top 25% of states in personal income to the bottom 25%, and below Alabama (adjusted rank 33) and Arkansas (adjusted rank 31). New York (adjusted rank 29) ends up after adjustments in the bottom 50% of states and below Texas (adjusted rank 22) and Louisiana (adjusted rank 21).
So let me ask you, dear reader, are the advantages of more services from a high-tax state worth the costs of the taxes? And is there not a correlation between the cost-of-living in a state and the extra costs imposed on businesses by a large, intrusive, highly regulating state?
Views: 1,762