How Is Donald Trump Doing Economically in June 2017?
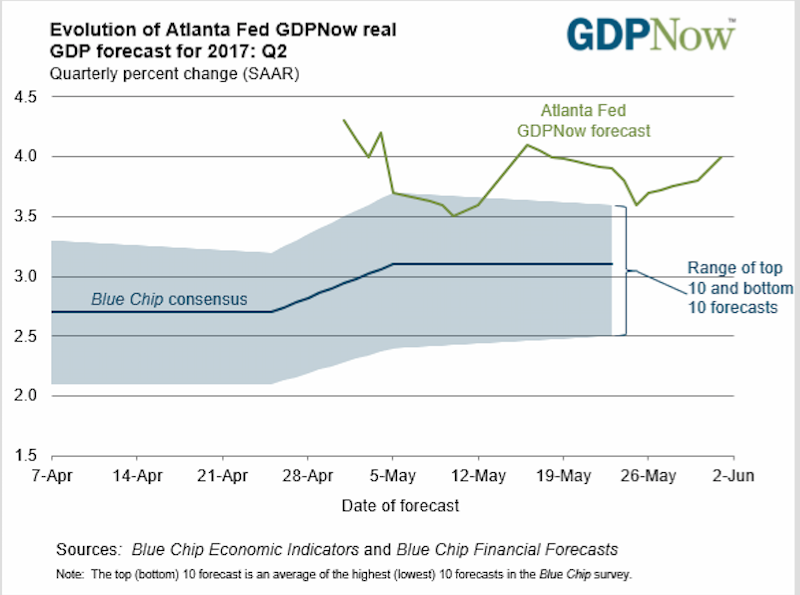
The time evolution of the Atlanta Federal Reserve Bank’s GDPNow forecast for the second quarter of 2017.
Image and Data Credit: Atlanta Federal Reserve District Bank / Center for Quantitative Economic Research
Just a few days ago, in my post U.S. Economy and Stock Markets, May 2017, I noted there were of a number of economic statistics pointing to current and future economic growth somewhat greater than the stagnant levels to which we became accustomed under Obama. In just those few days, I have found even more economic tea leaves for us all to ponder.
The Optimistic Economic Tea Leaves
One way or another, all of the improvements in economic statistics can be traced to the election of Donald Trump as President of the United States on November 8, 2016. It is actually quite remarkable that we can see any abrupt economic improvements since Donald Trump’s election, given the years of economic decline that preceded it under Barack Obama. Given the size and complexity of the economy, one would have thought it would take at least a quarter, or even six months, to change our economic direction. The fact that what improvements we can see began almost immediately with Trump’s election points to its cause as a massive change in psychology on the part of American business leaders. Typical of the time behavior of the improving statistics is the St. Louis Federal Reserve District Bank’s Leading Index of the U.S. displayed below.

Image Credit: St. Louis Federal Reserve / FRED
The blue curve is the Leading Index, with the heavy green line being the linear trend in Obama’s last years from December 2014 to Trump’s election. Quite clearly, it depicts the long economic decline under Obama, interrupted by Trump’s election after which it has oscillated. What links this economic improvement to a change in corporate psychology is the plot of manufacturers’ new orders for non defense capital goods, shown below.

Image Credit: St. Louis Federal Reserve District Bank / FRED
This leading indicator is a measure of how much corporations are investing in their productive capacity. It should be obvious from this graph that Trump’s election has motivated American companies to greatly increase their investments in the economy. This has happened after a very long decline in investment during the Obama years.
These indicators were discussed along with a number of others in the post U.S. Economy and Stock Markets, May 2017. Also noted in my recent survey of the economy was the results of these economic improvements have not yet shown up in our national bottom line, i.e. in the GDP growth rates through the first quarter of 2017. The first quarter annualized growth rate was only 1.2%, an Obama-era kind of growth rate. However, the Atlanta Federal Reserve District Bank is providing us with a very different kind of picture for the second quarter, shown as the theme image at the very top of this post. Their Center of Quantitative Economic Research maintains a statistic called GDPNow, which is their best guess of what the current quarter’s annualized GDP growth rate would be. The plot in the theme image shows how that estimate for the second quarter has varied in time. Also, shown in that plot is the range of estimates from the top ten and bottom ten Blue Chip forecasters. The Atlanta Fed’s GDPNow estimate at +4.0% is somewhat more optimistic than the Blue Chip Forecast range between 2.5% and 3.5%. Nevertheless, any of these possible growth rates would be a great improvement over Obama-era growth rates.
While statistics on investment and output tell a rosy story, those on the health of the labor market remain definitely equivocal. In fact, they might possibly be described as schizophrenic. On the one hand, the change in the Federal Reserve’s Labor Market Conditions Index (LMCI), possibly the most perfect coincident economic indicator ever invented, tells us the health of the labor market is better than in recent years and is improving.

Image Credit: St. Louis Federal Reserve District Bank / FRED
Again, the heavy red line shows the linear trend, with the change in the LMCI declining in the last Obama years ending with Donald Trump’s election. Since then the LMCI has improved, although it does appear to have hit a plateau in the last two months.
On the other hand, although the headline U3 unemployment rate for May is down to 4.3%, the increase in new jobs appears to be slowing, even though “Job openings are near all-time highs. It suggests that businesses are struggling to fill these positions in an increasingly tighter market.” This is according to Beth Ann Bovino, chief U.S. economist for S&P Global Ratings, as quoted by the Wall Street Journal. The WSJ article goes on to quote a construction firm CEO, Ryan Maibach, president of Barton Malow Company, that there is a real shortage of skilled construction workers, particularly carpenters and plumbers. “Trying to find an additional 15 or 20 people is no small feat.” According to the Labor Deparment’s Bureau of Labor Statistics (BLS), the nonfarm payroll employment increased by only 138,000 in May. On the same website where the BLS publicized that increase, they posted a bar chart showing the month-over-month increase in nonfarm employment since May 2015, shown below.

Department of Labor / Bureau of Labor Statistics
A short inspection should convince you the linear trend has been downwards, and shows no evidence yet of changing.
If in fact positions being offered are increasing and not being filled because the labor supply is just not there, one would have expected companies to have bid wages up as they compete with each other for scarce skilled labor. Yet, that has not happened, as the rate of increase in wages is approximately the same as the rate of CPI inflation. The Wall Street Journal demonstrates this in a plot over time of the rate of increase of average hourly earnings, shown below.

Image Credit: Wall Street Journal, Data Source: Labor Department
Notice the current year-over-year wage increase rate is 2.4%, whereas the current CPI inflation rate according to the Federal Reserve is 2.2%. This makes the real average wage increase rate (nominal rate minus inflation) a paltry 0.2%, almost stagnant wage growth.
How can we explain this conundrum? In a tight labor market wages should be increasing. One possible answer is the global labor market is not so very tight, and American workers must compete with foreign workers. Yet another factor is the profits of American companies have been suppressed by bad federal government policies throughout the Obama era. For that reason, companies might well seek to protect their profit margins by holding down wages. Any changes in government policies that would help companies to increase their earnings might then make them more capable of competing for scarce labor by raising wages.
Just as worrisome, however, is the fact that the domestic labor markets do not have enough skilled workers to satisfy the needs of companies. This is a cultural and political problem as much as an economic one. Why have our educational systems not provided workers with the requisite skills? This is a profound and fundamental problem with our schools, colleges, and universities, and can probably be solved only after many years. This, of course, assumes our schools can even recognize the problem.
Headwinds Ahead
So far, the only objective economic changes that might justify the uplift in corporate psychology and encourage companies to continue their growth have come from presidential executive orders. Fortunately, the reduction in the federal regulatory burden on companies is second in importance only to tax cuts and reforms in the minds of most corporate CEOs. In a Business Roundtable survey of 141 CEOs between February 8 and March 1, the heads of these companies were asked what government action would be most important in boosting their growth. The response of 52% was that tax reform would be most important, 27% said regulatory reforms, while 15% responded with infrastructure investment.
Last year the costs of federal regulations on the economy added up to a record high of $1.9 trillion, a hidden tax of a whopping $15,000 on every American household. With annualized GDP currently around $19.03 trillion in the first quarter of 2017 according to the Federal Reserve, the regulatory costs have reached approximately 10% of GDP. If half, or a third, or even a quarter of that regulatory burden could be eliminated, that reduction could fuel a huge expansion in economic growth.
Nevertheless, the biggest promise for economic growth lies in tax reduction and reform. The United States has the world’s worst and highest corporate taxes, with a top statutory rate of 39.1%, with only Chad and the United Arab Emirates levying higher corporate taxes. Currently, the average corporate tax rate in Europe is 22.5%. This fact often renders U.S. multinational corporations noncompetitive with their foreign competitors, not only abroad but domestically as well. Not having as large a tax burden as U.S. companies, foreign companies can price their products at significantly lower prices for the same or even higher profits. No wonder we are having problems with the off-shoring of U.S. jobs and industries! The best answer to this problem is not tariffs or the protectionism of mercantilism, but the reduction of U.S. corporate tax rates to equal or below those of our competitors.
Unfortunately, as most everyone knows, the Republicans in Congress are mired in a swamp of disagreements about how tax reform should be constructed. This is not to mention all the GOP disagreements about “repeal and replace” of Obamacare, which would count as both a reduction in economic regulations as well as an enormous tax cut for many. How long can economic growth be increased merely by presidential edicts reducing economic regulations, with no cuts and reforms of taxes? That is an open question.
Views: 2,774


