


Do U.S. Companies Need Tax Cuts?
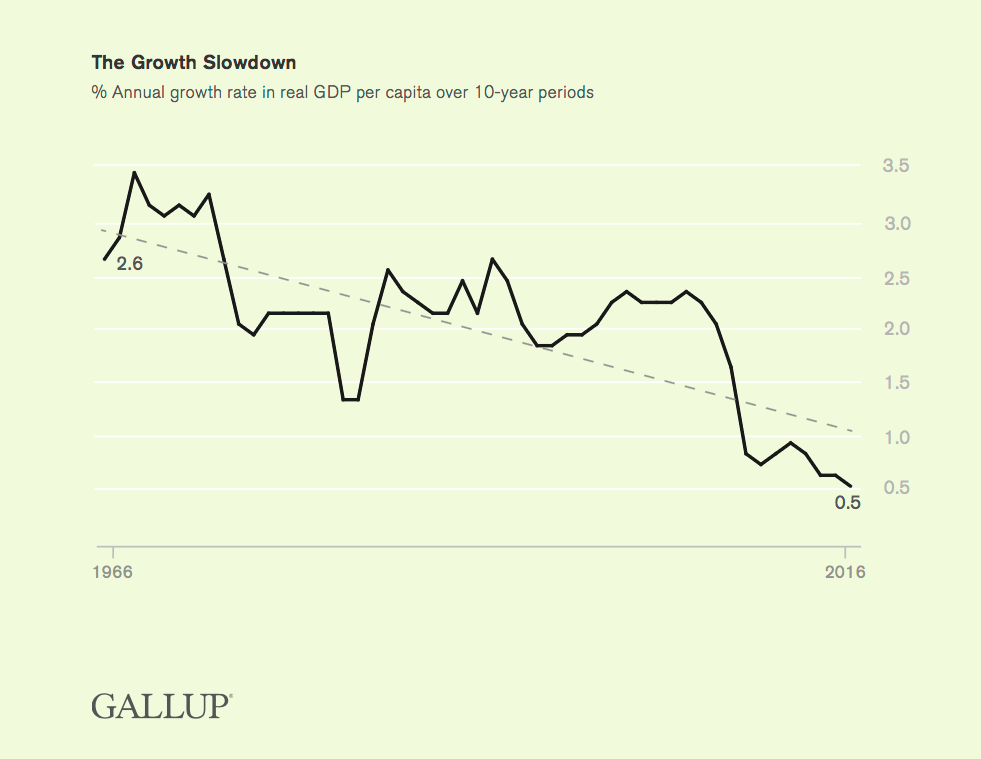
Plot of annual Real U.S. GDP per capita growth in percent averaged over ten year periods. This is the major reason why huge U.S. corporate tax cuts are needed!
The Gallup Organization
About a month ago, I was having a conversation with a gentleman of the progressive persuasion about U.S. corporate tax cuts. I was trying to persuade him the U.S. desperately needed very large corporate tax cuts to restart economic growth. Otherwise we are doomed to secular stagnation, if not indeed secular decline. Being a progressive, he of course did not agree.
The Issue, and Why You Should Be Absorbed by It
This progressive gentleman made the claim, made by many other progressives, that most U.S. corporations use tax deductions and credits to reduce their taxes to almost nothing. He said that instead of lowering corporate taxes, we should increase them, both by raising corporate tax rates and by eliminating tax deductions. You can find this progressive sentiment in posts all over the internet, for example here, and here, and here, and here.
Although I was fairly sure he was in general wrong, nevertheless I could not authoritatively make that claim. I had never really studied how much of their earnings U.S. companies pay in taxes. Given our incredibly complex tax system, there certainly had to be a great many companies who took every advantage the tax code allows to minimize Uncle Sam’s bite on their earnings. On its surface, this progressive view of economic reality sounds more than a little plausible. I immediately resolved to remedy my ignorance by doing a fairly extensive study.
Before I share the results of my study, I would like to suggest why this is an incredibly important issue, and why you should be interested enough to read on. The neoliberal (aka “conservative”) view is that government taxes entirely too much, taking economic resources away from both the people and companies, who would do a much better job allocating those resources to solve economic and social problems. Progressives, of course, usually take the opposite view.
However, as the graph at the top of this post points out, we are in a period of secular economic stagnation. The plot is a moving time average of annual U.S. GDP growth, with the average taken over ten year periods. The reason for the average is to take out the effects of economic booms and recessions to reveal the secular long-term trend. In this context, the word “secular” refers to trends independent of the business cycle. Clearly, on average the GDP growth rate has been declining at least since 1966, and has come very close to zero. Staring us in the face is the threat we might enter into a period of actual secular decline!
While progressives believe it is failures of the free-market that are to blame for this and other social problems, neoliberals point to the accumulation of progressive policies over the past century as the real causes of our economic and social malaise. See the posts Why Isn’t the US Economy Booming? and Progressives’ Disrespect for the US Constitution for the basic arguments.
A particularly important aspect of our economic stagnation has been the loss of American jobs to overseas due to off-shoring of production. Almost always the off-shoring of U.S. jobs has been blamed on much lower foreign wages, but the cost savings to American companies and consumers by buying from foreign sources is due to much more than that. Much of wage cost savings is nulled out by the added cost of transportation of the finished goods to the United States. Foreign companies are sometimes less ham-strung by economic regulations, but more important than that is the much smaller tax burden most foreign companies have to bear. Taxes are just another cost of production as far as a company is concerned, and must be passed along with other costs in the price of the good. The higher American corporate taxes are, the more the competitive advantage enjoyed by Americans’ foreign rivals. The lower their own taxes are, the lower the price a foreign company would have to offer to get the same profit.
So how much of a tax advantage do foreign companies have over the United States? Concerning the American corporate tax burden in 2016, the Tax Foundation writes,
It is well known that the United States has the highest corporate income tax rate among the 35 industrialized nations of the Organisation for Economic Co-operation and Development (OECD). . . . Expanding the sample of countries and tax jurisdictions to 188, the U.S.’s corporate tax rate of almost 39 percent is the third highest in the world, lower only than the United Arab Emirates’ rate of 55 percent and Puerto Rico’s rate of 39 percent. The U.S. tax rate is 16.4 percentage points higher than the worldwide average of 22.5 percent and a little more than 9 percentage points higher than the worldwide GDP-weighted average of 29.5 percent. Over the past ten years, the average worldwide tax rate has been declining, pushing the United States farther from the norm.
The U.S. 39 percent corporate tax rate is the sum of the 35 percent federal tax rate plus the average state tax rate. In the same post, the Tax Foundation noted the average European corporate tax rate is 18.88 percent by region, or 22.6 percent weighted by GDP. With such huge corporate tax advantages, it is no wonder so many jobs and so much production has been off-shored to other countries. These facts also help explain why so many U.S. corporations have abandoned the United States to re-establish themselves as foreign companies through corporate inversion.
But then, if you believe the progressives, U.S. companies are not paying anywhere close to the nominal 39 percent tax rate because of all the tax deductions and write-offs available to them. What is the truth?
What Does Data Say About All This?
The progressive hypothesis about the real effective corporate tax rates is actually easily testable, even if the test is somewhat exhausting to carry out. What I did was to calculate the effective tax rates for every company in the Standard and Poors 500. For each of these companies, I obtained their earnings before taxes and their tax information for the year 2016 from the Morningstar.com website. Dividing their taxes by their earnings before taxes and multiplying by 100% then yielded their effective tax rate, taking into account any tax breaks they took.
There are two special cases that need to be noted. The first is if a company has more tax credits than taxes, in which case the taxes are negative (the government pays the company, not the other way around) and the effective tax rate is negative. The second case is where a company has no earnings, but an overall loss instead. In that case no meaningful tax rate can be defined; I ignored all companies with losses. Among the S&P 500 a total of 46 — or 9.2 percent — reported losses for 2016. You know you are living in economic hard times when almost one-tenth of your largest companies can not make a profit!
After calculating the effective tax for all 454 companies having profits, I next constructed a scatter plot of each company’s effective tax rate versus their earnings before taxes. The result is displayed below.

Data Source: Morningstar.com
Note that because of tax breaks, most companies have effective tax rates less than the U.S. nominal corporate tax rate, but greater than either the European or world average tax rates. Of these companies, 26 had effective tax rates above the U.S. nominal rate (federal plus average state) of 39%; 287 had rates between the European average of 18.88% and the U.S. nominal rate; 102 had rates between 0% and the European average; and 39 companies had negative tax rates, i.e. the government paid them money because of tax breaks. The remaining 46 companies in the S&P 500 had losses rather than profits, and a meaningful effective tax rate could not be defined for them.
A little addition then shows that of the 454 companies for which tax rates could be defined, 313 or 68.9% had effective tax rates above the European average. Companies with effective rates below the European average were 141 or 31.1%. This is a very different picture from the one painted by progressives, with almost seven-tenths of U.S. companies being at a competitive disadvantage with European corporations just because of taxes. If we want to bring back jobs from overseas, stop the migration of our companies to foreign countries, sell more to international markets, and increase our economic growth rate, we must drastically reduce our corporate tax rates to at least the European average of 18.8%.
Nevertheless, the data above does show a significant fraction of U.S. companies do not pay an appreciable amount of taxes. Some of these apparently enjoy tax favors from the government that others do not have. In order to get a feel for the kinds of companies enjoying government favoritism, I plotted the results according to economic sector. The S&P 500 companies can be separated into 11 Global Industry Classification Standard (GICS) sectors: consumer discretionary, consumer staples, financials, industrials, health care, information technology, real estate, telecommunications, and utilities. I separated the plot into three different plots with different symbols denoting each type of company. Because of the huge number of data points, this separation was necessary to keep the data points from totally obscuring each other.

Data Source: Morningstar.com
It would appear from the plot that the financials sector enjoys a great deal of government favoritism.

Data Source: Morningstar.com
From this last plot, the obvious conclusion is that many companies in the health care sector are getting inordinate government breaks. For this a lot of the blame has to go to Obamacare.

Data Source: Morningstar.com
This plot strongly suggests that tax breaks for companies in the real estate and information technology sectors could be usefully scrutinized.
These last three plots hint at a possible compromise between neoliberals and progressives on taxes: That progressives could accept a significant decrease in nominal corporate tax rates in exchange for an elimination of many tax breaks targeted to specific economic sectors. From the neoliberal perspective, targeted tax breaks are an especially perverse form of crony capitalism. Neoliberals would much prefer to have free-markets determine economic winners and losers, rather than have government choose them. Progressives are much more ambivalent on this subject, but they tend to be against giving any kind of breaks to large corporations whatsoever.
From all of the above, one point is very sure. The next time a progressive tells you U.S. companies do not pay appreciable taxes, you can tell him he is full of a lot of hooey!
Views: 2,954