Another Great Progressive Disaster: California
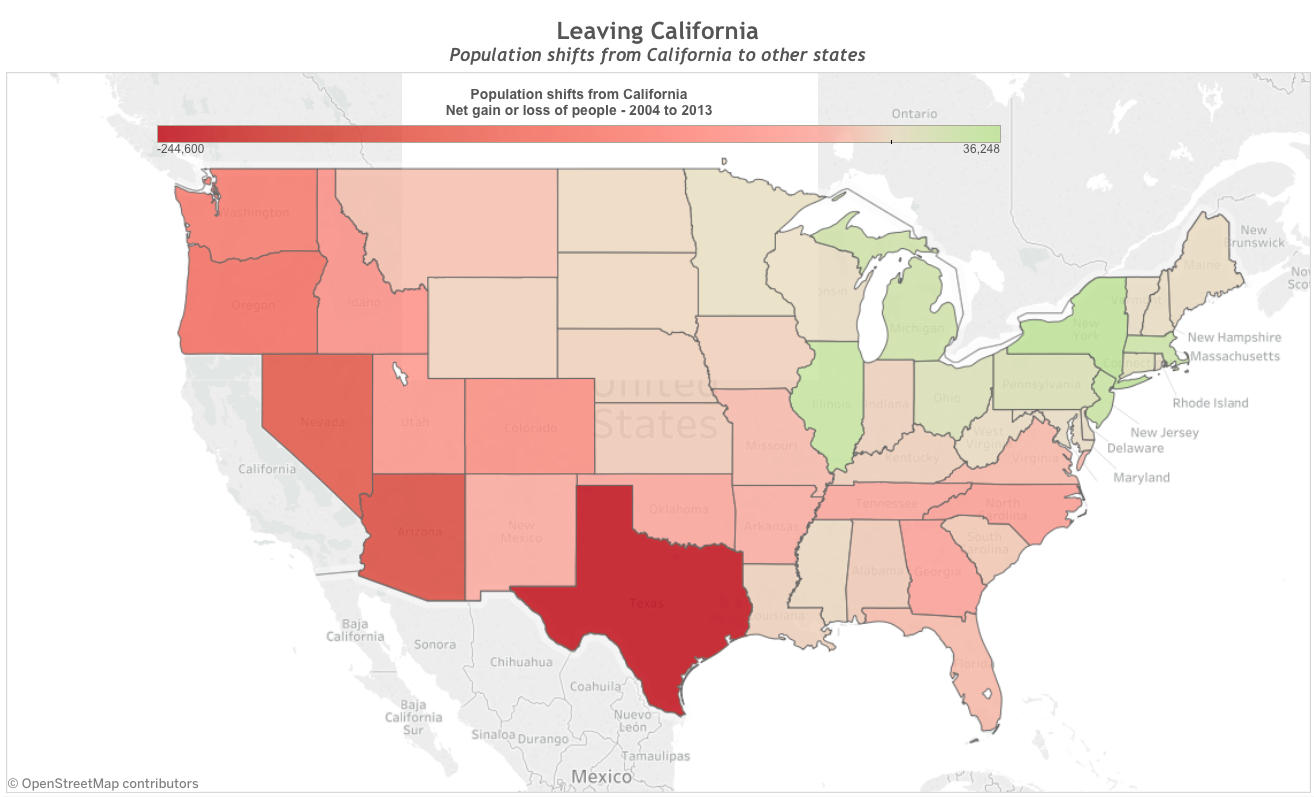
Cumulative net migration to and from California to other states from 2004 to 2013.
The Sacramento Bee
An even greater disaster for American progressivism than the state of Illinois is the not-so-golden state of California.
California Is Hemorrhaging Population . . .
As can be gleaned from the post’s theme image above, California is bleeding people to almost every state in the union, with the exception of a few blue states in the East and Midwest. However, even the cumulative gains from those blue states between 2004 and 2013 are greatly dwarfed by the cumulative losses to all the rest of the country. Clearly, the largest losses were to the quintessentially red state of Texas.
California’s population losses can be attributed to high state taxes, state economic regulations leading to a very high cost of living, and losses of jobs by companies either migrating to a better economic environment in other states or going out of business altogether. As can be seen from the following bar graph for California (taken from the 10th edition of Rich States, Poor States by Arthur Laffer, Stephan Moore, and Jonathan Williams), California has suffered continual population losses throughout the period 2006-2015. From a peak of around 310,000 in 2006, the losses were temporarily stemmed by the financial crisis of 2007-2008 and the consequent Great Recession.

A. Laffer, S. Moore, J. Williams. Rich States, Poor States, 10th Ed. 2017. p. 7
Once it became economically possible again for a greater number of people to move out-of-state, the out-migration began to increase again, with the exception of a single small dip in 2014. In 2015 the annual net loss increased to nearly 110,000, and it appears to be accelerating. As shown in the chart, the cumulative net loss between 2006 and 2015 was an astounding 1.1 million people! With a current population estimate of 39.3 million, this amounts to a population loss over the decade of 2.8% of their present population. And the population loss is accelerating! Many other sources cite a loss of about 5 million people between 2004 and 2013, a loss of approximately 12.7 % of present population.This can not continue for much longer without a severe loss of political power through reapportionment.
It is not hard to find the reasons for the disaffection of California residents leading to their abandonment of California. Predominantly, this disaffection is among the poor and the middle class, not among the rich. As one might expect from state government policies driving up taxes and cost-of-living and causing the dissolution of businesses, it has been the poor and the middle class that have been principlely affected. According to the Sacramento Bee, California has the nation’s highest rate of real poverty.
A new supplemental poverty measure by the Census Bureau, covering the 2013-15 period, found that nearly 8 million Californians, 20.6 percent of the state’s residents, are living in poverty.
A few years ago, the Public Policy Institute of California devised the California Poverty Measure, which is similar to the Census Bureau’s supplemental index, and came up with a 21.8 percent poverty rate.
The PPIC study also revealed that the state’s highest level of poverty, 26.1 percent, was to be found in Los Angeles County, home to a huge immigrant population working at low-skill, low-wage jobs but confronting very high housing costs in relation to their modest incomes.
The Legislative Analyst’s Office (LAO), a state government office that bills itself as “the California legislature’s nonpartisan fiscal and policy advisor”, noted that California housing was far more expensive than in the rest of the nation, and that this was because far less housing was being built in the coastal areas than was being demanded. Therefore, as one would expect from the law of supply and demand, housing prices have been bid up to ridiculous prices. (I once owned a house in Culver City, a suburb of Los Angeles, a matchbox that cost us approximately $170K that was recently sold for three-quarters of a million dollars!) As evidence the LAO offers the following bar chart.

California Legislative Analyst’s Office
CNN Money reported in November, 2016,
For every home buyer coming into the state, there are three Californians selling and moving elsewhere, according to data analysis firm CoreLogic.
California’s housing market is one of the most expensive in the nation, with a median home price of $428,000 across the state. Prices have shot up 71% since 2011.
And a number of its local markets are prohibitively expensive. Of the five priciest housing markets in the country, four are in California, according to the latest data from the National Association of Realtors. San Jose tops the list with a median home price of $1 million.
And why is there so little housing compared to the demand being created in California? The LAO gives the following answers.
- Community Resistance to New Housing. Local communities make most decisions about housing development.Because of the importance of cities and counties in determining development patterns, how local residents feel about new housing is important. When residents are concerned about new housing, they can use the community’s land use authority to slow or stop housing from being built or require it to be built at lower densities.
- Environmental Reviews Can Be Used to Stop or Limit Housing Development. The California Environmental Quality Act (CEQA) requires local governments to conduct a detailed review of the potential environmental effects of new housing construction (and most other types of development) prior to approving it. The information in these reports sometimes results in the city or county denying proposals to develop housing or approving fewer housing units than the developer proposed. In addition, CEQA’s complicated procedural requirements give development opponents significant opportunities to continue challenging housing projects after local governments have approved them.
- Local Finance Structure Favors Nonresidential Development. California’s local government finance structure typically gives cities and counties greater fiscal incentives to approve nonresidential development or lower density housing development. Consequently, many cities and counties have oriented their land use planning and approval processes disproportionately towards these types of developments.
- Limited Vacant Developable Land. Vacant land suitable for development in California coastal metros is extremely limited. This scarcity of land makes it more difficult for developers to find sites to build new housing.

Sacramento Bee / U.S. Census Bureau
As can be seen from the map, most out-migration of poor people went to red or border-line red states where they could find better economic opportunity.
. . . And Businesses As Well!
But it is not just people who have abandoned California. Many of the businesses that give people jobs have also sought greener pastures and left the state. Just this April a post on Fox&Hounds, a website “Keeping tabs on California Business and Politics” as they put it, noted a year ago the hamburger company Carl’s Jr. relocated its headquarters to Nashville, Tennessee. It also reported Toyota is in the process of removing its U.S. headquarters from Torrance to Dallas, a move it should complete by the end of 2017. Also leaving for Dallas is Jacobs Engineering Group, a $6.3 billion firm formerly in Pasadena. It has 230 offices worldwide, employs 60,000, and generates $12 billion in sales annually. The Washington Times in a 2015 article listed Raytheon Space and Airborne Systems, eBay, Occidental Petroleum, firearms retailer RifleGear, and Nissan as bailing on the state. The Dallas Business Journal quoted Joseph Vranich, a site selection consultant and president of Irvine, California-based Spectrum Location Solutions, as saying roughly 9,000 California companies moved out of state or diverted projects in the seven years between 2008 and 2015. Among the highlights of Vranich’s study was that Texas was the leading destination for the migrating companies, followed in order by Nevada, Arizona, Colorado, Washington, Oregon, North Carolina, Florida, Georgia, and Virginia. With the exception of the blue states of Washington and Oregon and the semi-blue state of Virginia, all of the remaining seven states on this list are either red or semi-red. You can access Vranich’s entire study by clicking here.
The stagnation of California’s economy and the flight of companies from it have the same explanations as the stagnation of the European economy: over-taxation and over-regulation. The Mercatus Center at George Mason University ranks California as next to dead last in economic freedom among the 50 states. They note that the state has among the highest taxes in the nation. Their combined state and local tax collections were reported by Mercatus to be 10.8 percent of personal income in 2014. Concerning state regulatory policy, Mercatus writes,
Regulatory policy is even more of a problem for the state than fiscal policy. California is one of the worst states on land-use freedom. Some cities have rent control, new housing supply is tightly restricted in the coastal areas, and eminent domain reform has been nugatory. Labor law is anti-employment, with no right-to-work law, high minimum wages, strict workers’ comp mandates, mandated short-term disability insurance, and a stricter-than-federal anti-discrimination law. Occupational licensing is extensive and strict, especially in construction trades. It is tied for worst in nursing practice freedom. The state’s mandatory cancer labeling law (Proposition 65) has significant economic costs. It is one of the worst states for consumer freedom of choice in homeowner’s and automobile insurance.
The Moribund State Finances
All of these problems both exacerbate and in feedback are exacerbated by the state’s ruinous fiscal policies. Just like Illinois, California both at the local and state levels has problems paying for the pensions of those retired from government service. Pensions for all levels are managed by the California Public Employees’ Retirement System (CalPERS), and over the past several years it has had to spend millions of dollars to defend itself and the employee pensions of two bankrupt California cities, Stockton and San Bernardino. The generous defined benefit pension plans are currently woefully underfunded to the tune of somewhere between $300 billion and $1 trillion depending on assumptions of returns from the stock market. Since CalPERS obtains assets for paying pensions from both employee contributions and stock market investments, how much CalPERS is underfunded is uncertain. However it is estimated, it is a huge amount of money. With a state population of 39.3 million, this means that every Californian man, woman, and child owes between $7,634 and $25,445 to pay just for the unfunded liabilities. Unless CalPERS makes a big killing in the stock market sometime soon, something is going to break.
In addition to the unfunded liabilities of public pensions, California has $120 billion in authorized bond debt. State and local Californian governments have the same spending problems of progressive governments everywhere — they just can not stop themselves! Whether it is generous public pensions, generous welfare programs (California has 34% of the nations’ welfare recipients but only 12% of the U.S. population), or a bullet train to nowhere, progressive Californian politicians have never seen a spending program they do not like. The result on state spending from 1994 to 2015 can be seen in the graph below.

LiarLiar.com / State of California, Dept. of Finance
From the graph you can see California state spending increased by about 180% between 1994 and 2005, interrupted only briefly by the Great Recession. Over the same period, the California resident population grew by only 25%.
As California spending goes up, the need to increase taxes and the sale of general obligation bonds also grows. And as taxes increase more California residents and businesses are motivated to flee to more salubrious economic climates, reducing the capability of the state to tax more. The nature of this feedback mechanism should be pretty clear. So why do progressive politicians not see it?
Views: 2,061


