


A Not-So-Jolly Christmas
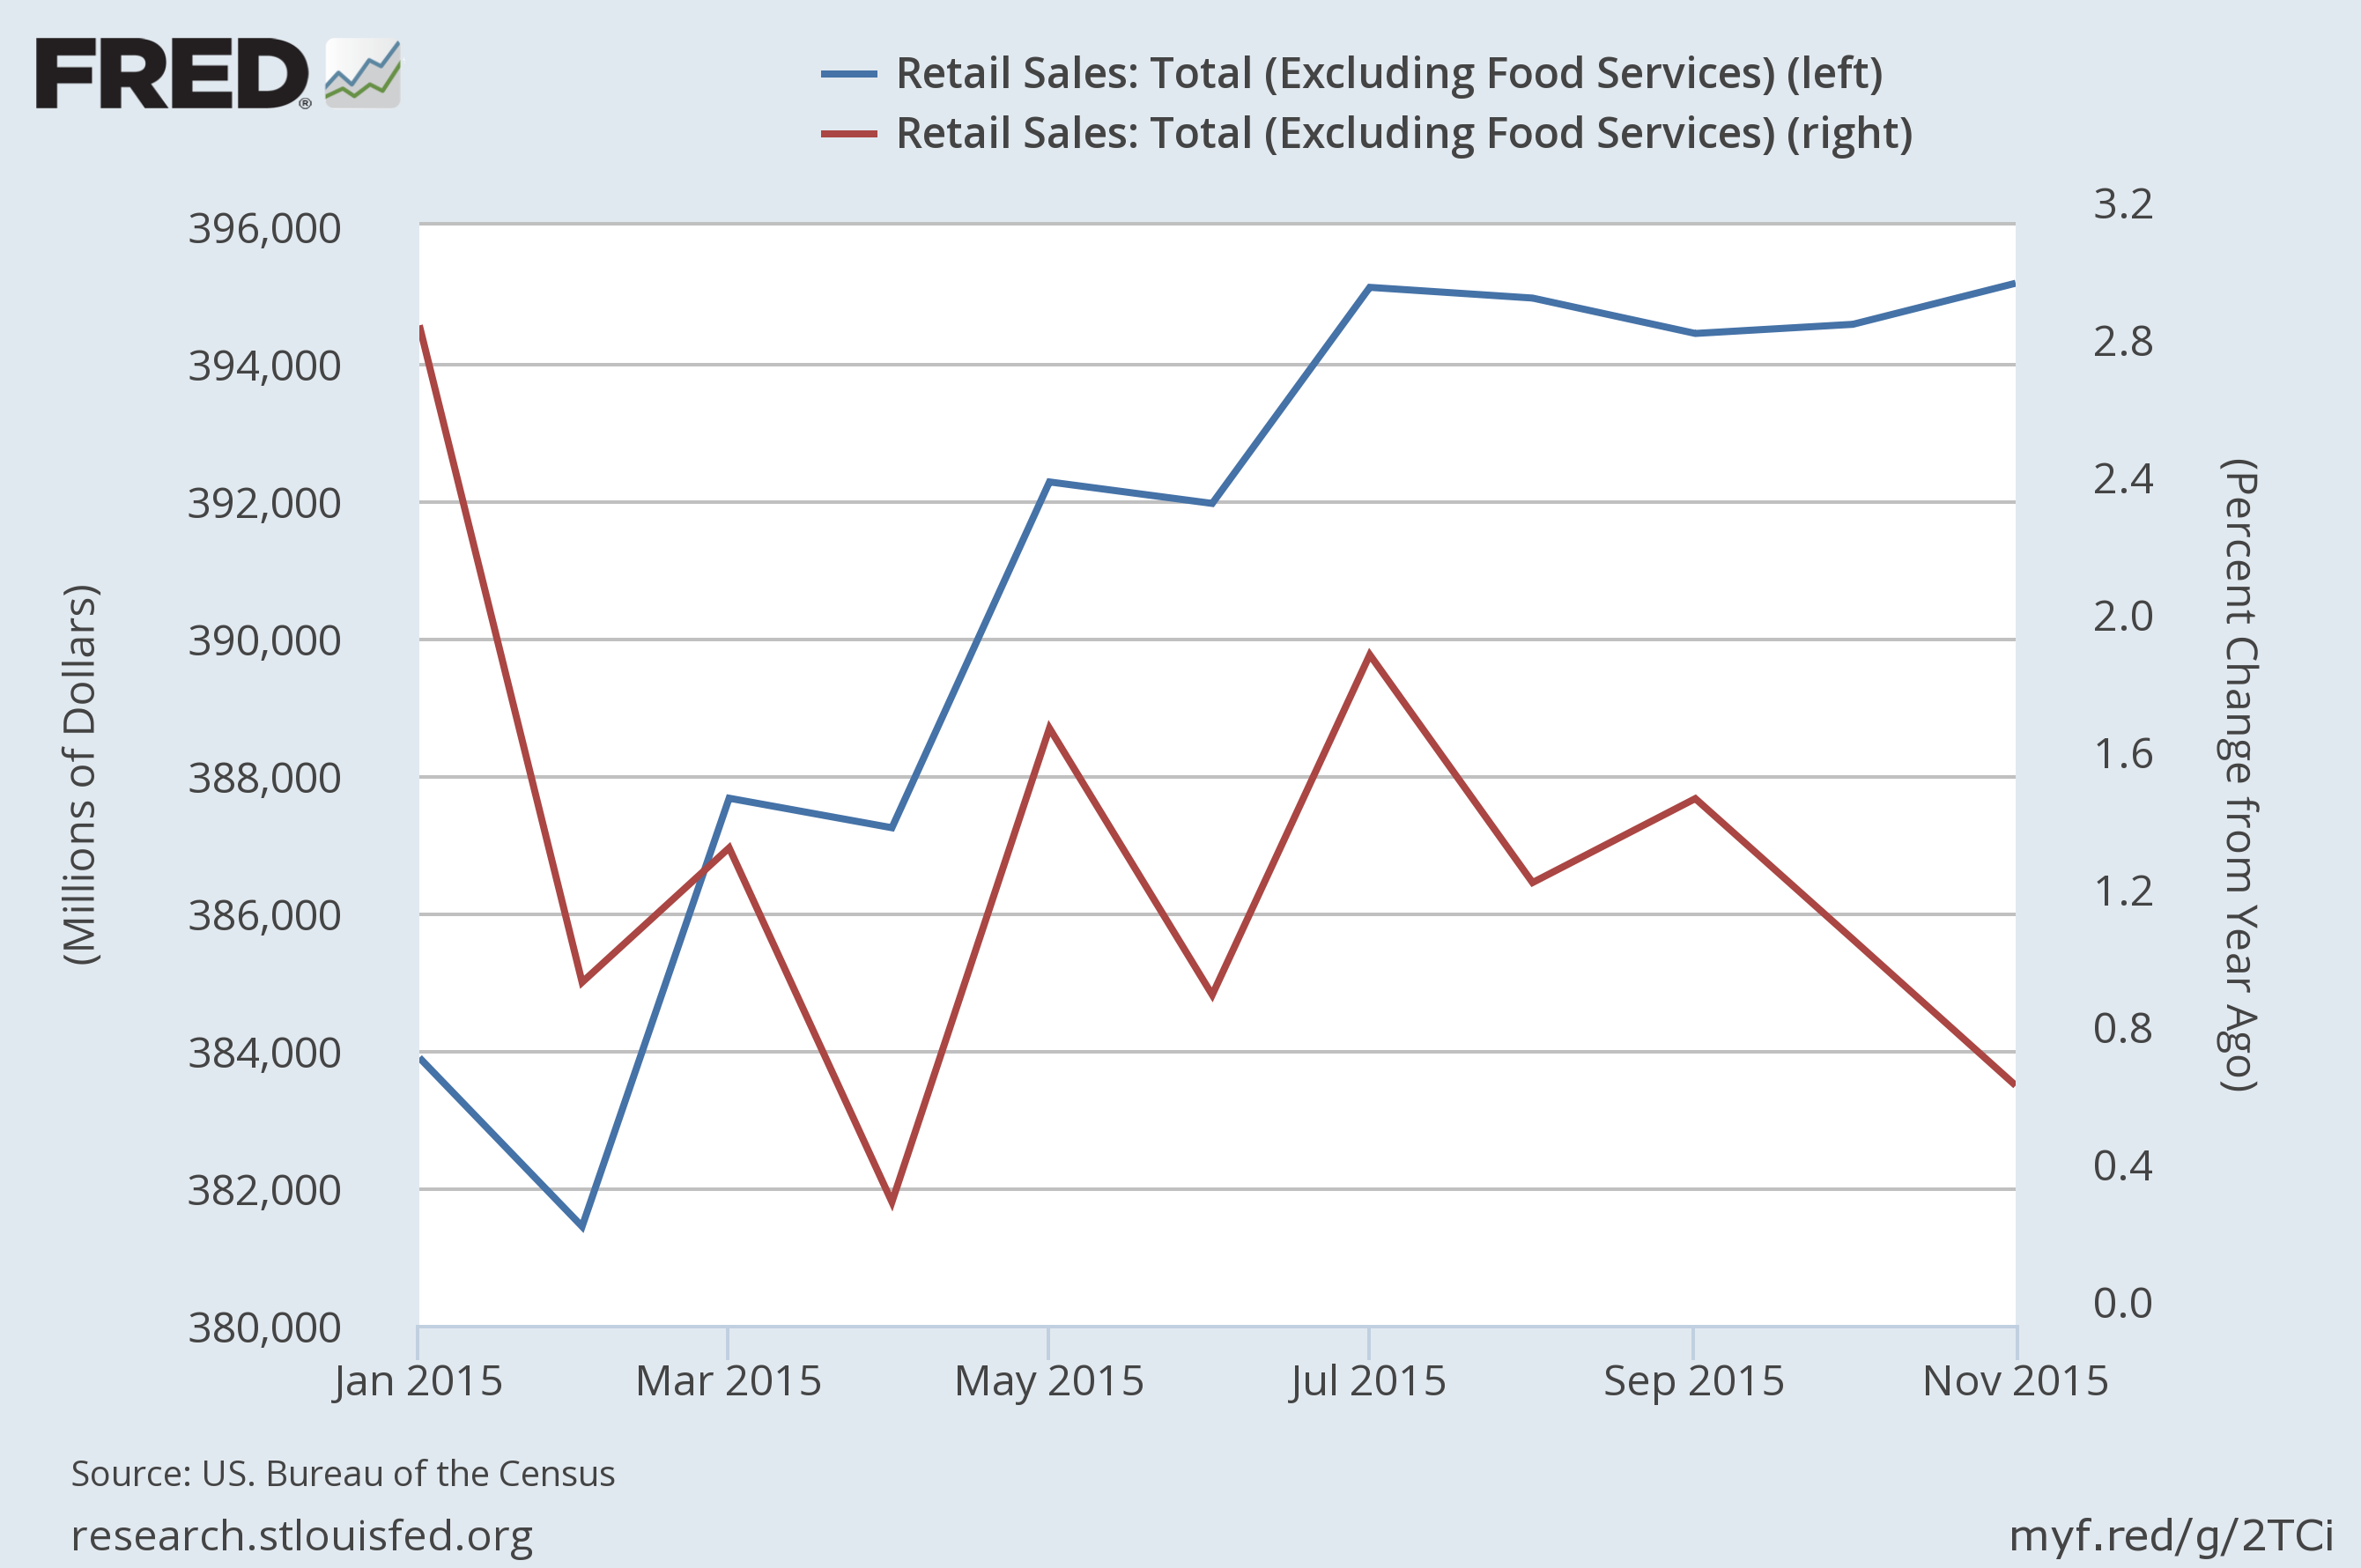
Total Retail Sales and its percent change from a year ago
Image Credit: St. Louis Federal Reserve Bank/FRED
Earlier this year, many had high hopes that the precipitous drop in oil and gasoline prices would fuel retail sales by consumers. The expectation was that the money not spent in fueling their cars would give households the means of buying many other products of the economy. It has not turned out that way, at least so far, as shown in the plot of total retail sales, less food services, above.
The graph shows total retail sales in the blue curve with the scale on the left-hand-side, and its growth rate as a percent change from a year ago in the maroon curve with its scale on the right-hand-side. Starting in February of this year, retail sales began to grow robustly. However, sales had fallen so far from last year’s sales, the actual growth rate from a year earlier was increasing very modestly. By July the sales growth had finished and the value of sales has been essentially constant ever since, while the percent change from a year ago is beginning to drop again. Uneasy households must be holding onto their assets, worried about hard times ahead.
Simultaneously, the inventories to sales ratio is climbing as shown in the plot below, Again, the blue curve is the actual inventory to sales ratio, while the maroon curve gives its percent growth from a year earlier. Remember, if inventories grow too much relative to sales, production must fall for at least some period of time to allow markets to clear. Companies can not afford for long to produce something they can not sell.

Image Credit: St.Lewis Federal Reserve Bank/Fred
With an inventory to sales ratio growth rate north of 7% per year and with essentially constant sales that may well drop soon, it would be quite remarkable if the economy continued to grow.
The Wall Street Journal has taken note of this disappointment in their post Cheap Oil Gives Little Help to U.S. Spending, in which they also noted world-wide downward pressure on all commodities, not just on oil. I made a short comment on collapsing commodity prices last August 7 in which I showed the following bar chart for commodity prices.

Image Credit: BusinessInsider.com
With the exception of oil from U.S. fracking, I have not heard of any great increases in supply for these commodities. If supply has not substantially increased for all but oil, the only reason for a general collapse in prices is a collapse in demand for them. When demand for almost all the raw materials to produce final consumer goods is falling, how healthy can the economy be, and how long before aggregate output falls?
What we are faced with is not just an economic contraction in the United States, but a world-wide contraction. As I noted in The Insanity of Negative Interest Rates, Europe is in such bad economic shape, the European Central Bank has decided not only to adopt Quantitative Easing (QE), but negative interest rates as well. Additional evidence for Europe’s economic woes can be found in my posts Echoes of the Great Depression: Europe and France in Distress. Then there are all of the problems Japan has, seen in Echoes of the Great Depression: Japan. On top of all this there are more than a few reasons to suspect China’s economy to be in the process of implosion. China’s economic problems are of such a scale, they can no longer be expected to help subsidize U.S. federal debt. China has wasted approximately $6.8 trillions in malinvestments between 2009 and 2013, which is about 40% of the U.S. GDP and approximately half of all Chinese investments in that four year period. As one might expect from a world-wide economic crisis, foreign trade is suffering with both exports out of and imports into the United States falling as shown below.

To complete this gloomy picture, the Wall Street Journal has reported a U.S. corporate climate where, not seeing avenues for profitable investments, companies are not making many investments in productive capacity. One important figure for corporate investment, orders for non defense capital goods excluding aircraft, declined by 3.8% through the first 10 months of 2015.
Given all this evidence for economic decline, it is hard to see how the American consumer can ride to the rescue of the U.S. economy. A drop in gas prices does not seem to be enough to motivate them to open up their wallets and to spend.
Have a very merry Christmas!
Views: 3,933